Workspace and coverage
The Workspace tab is where testing is actually recorded. It has two modes. With no asset selected it tracks the engagement as a whole. Focus an asset and it becomes that asset’s testing surface.
Engagement phases
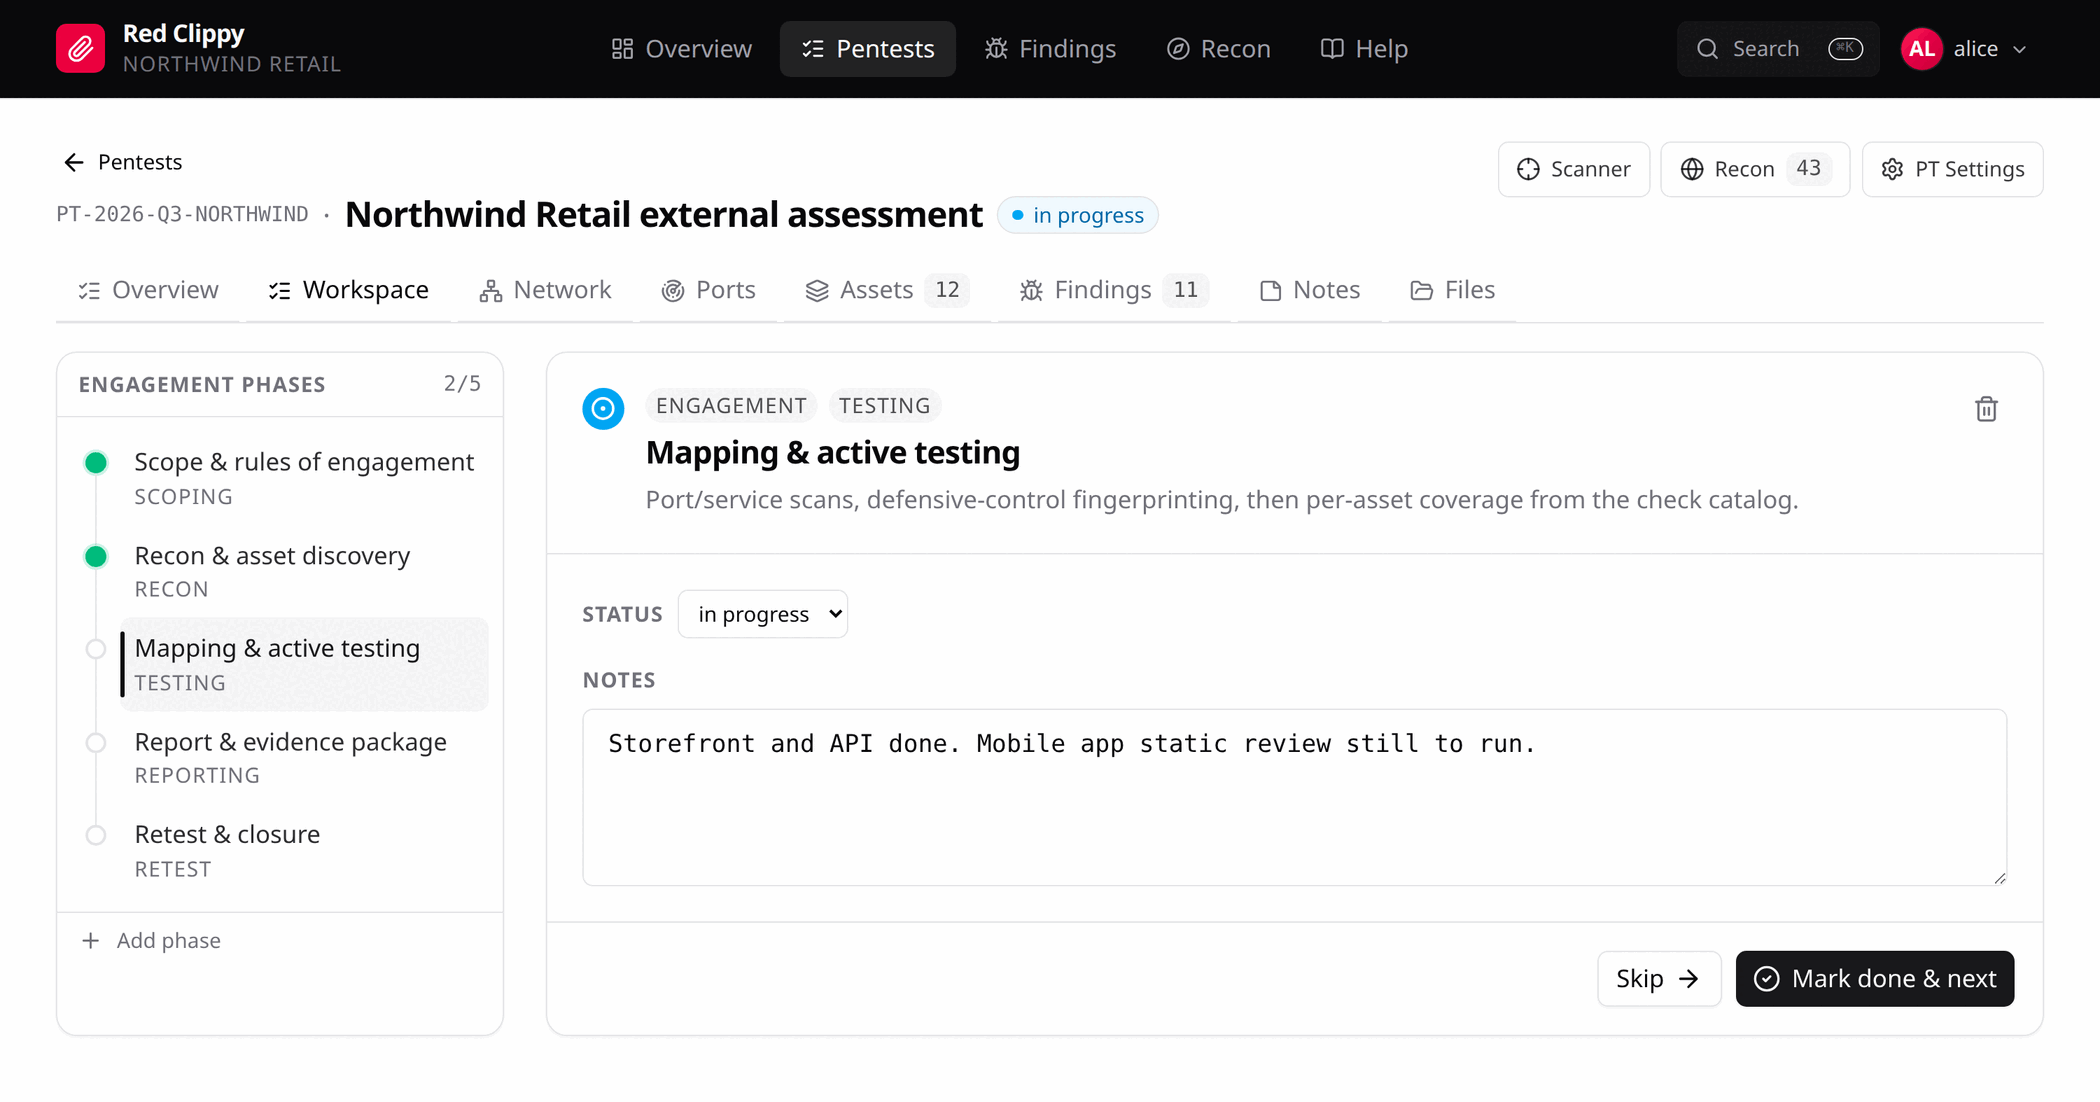
The left column lists the phases as a vertical timeline. Five are seeded with every pentest:
| Phase | Category | What it covers |
|---|---|---|
| Scope & rules of engagement | scoping | In-scope assets, exclusions, test windows, escalation contacts, retest policy. |
| Recon & asset discovery | recon | Subdomains, DNS records, ASN and IP ranges, certificate transparency, cloud assets, leaked secrets. |
| Mapping & active testing | testing | Port and service scans, control fingerprinting, then per-asset coverage. |
| Report & evidence package | reporting | Writeups with CVSS, impact, repro steps and evidence. |
| Retest & closure | retest | Retest fixed findings, close out, archive per the retention policy. |
The counter in the header (2/5) counts phases that are done or na.
Add phase at the bottom adds your own with a title and optional category.
The right pane is the selected phase: its status dropdown, a notes box, and two buttons. Mark done & next resolves the phase and jumps to the next unresolved one. Skip moves on without changing anything.
Notes save when the box loses focus, or on Ctrl+S. There are only five phases
and they last the whole engagement, so this is where the durable notes belong:
“client confirmed staging is behind the same WAF as production”.
Phases are deliberately coarse. Anything finer belongs in the per-asset checklist, where it can be tracked per target instead of once for the whole engagement.
Focusing an asset
Open an asset from the Assets page (Workspace on its row), from a finding’s affected-asset link, or from the command palette. The engagement tab strip is replaced by the asset’s own.
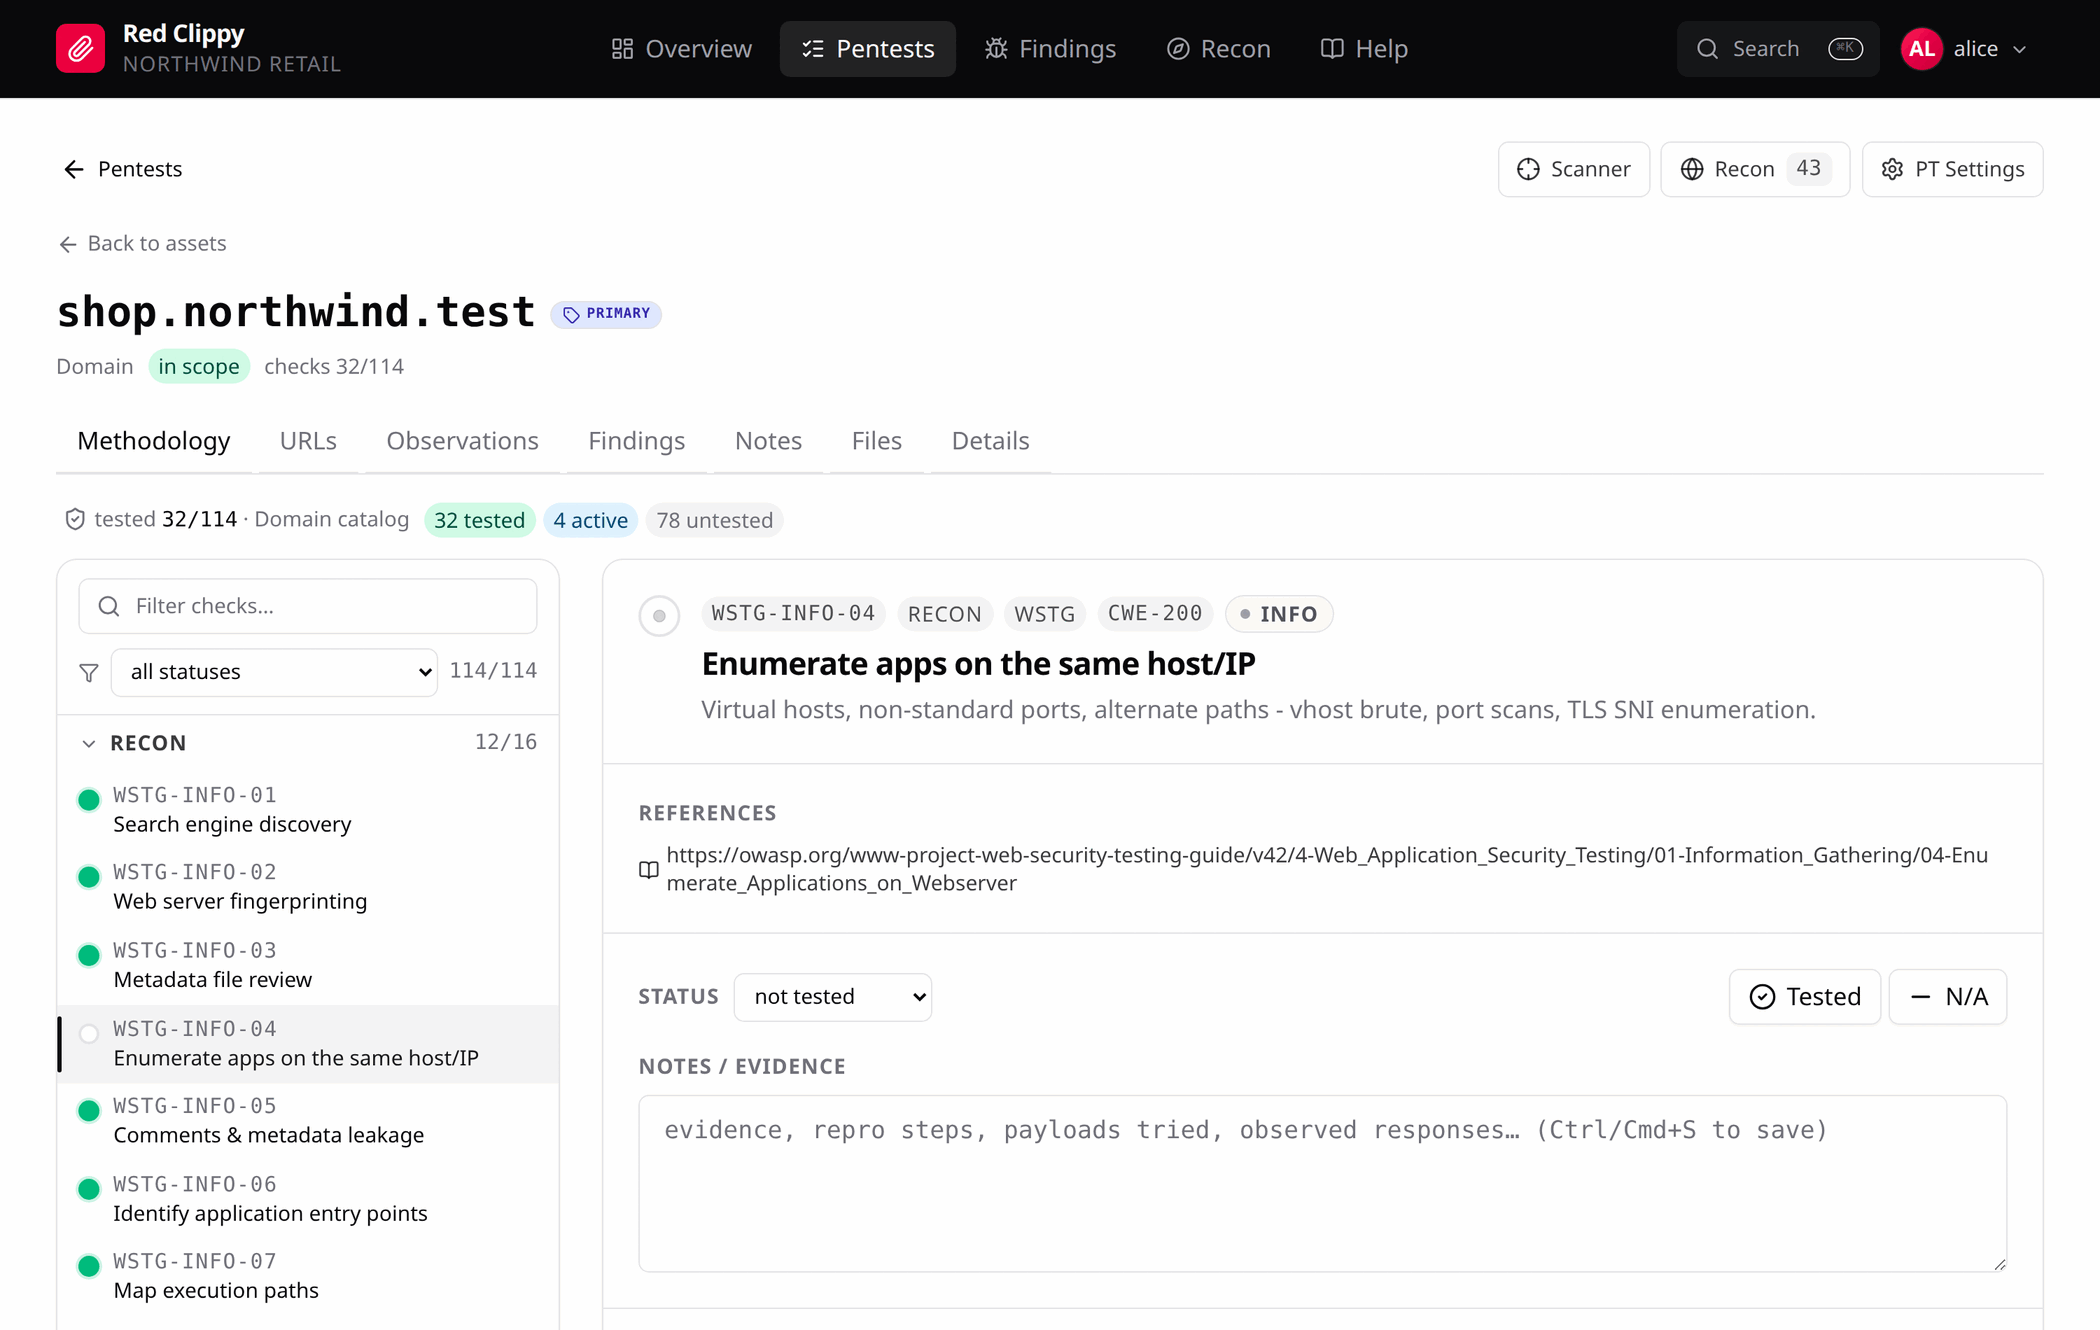
The title line shows the asset value, its kind, its scope state, its label if it has one, and its check progress. Tabs vary by kind:
| Tab | Shown for | What it holds |
|---|---|---|
| Methodology | all | The check catalogue for this asset. |
| URLs | domain, url | URLs discovered under this asset. |
| Endpoints | api | Structured API operations. |
| Ports | ip | Open ports on this host. |
| Observations | all | Everything else found here. |
| Findings | all | Findings tagged asset:<value>. |
| Notes | all | A notes field for this asset. |
| Files | all | This asset’s slice of the file area. |
| Import | ip only | Command hints and an upload box for scanner output about this host. |
| Details | all | Aliases, resolved addresses, label, provider, scope markings. |
Methodology
The coverage strip along the top counts the catalogue for this asset kind, then breaks it down: tested, n/a, active, blocked, untested.
The left column groups checks by category (recon, config, input, auth, authz, session, crypto, client, business logic, cloud) with a progress count on each. Only the group holding the selected check is expanded, which keeps the list short on a domain with 114 checks. Above it sit a text filter and a status filter, with a counter showing how many checks match.
Selecting a check fills the right pane with everything needed to work through it:
- the check code, category, standard (WSTG, API Top 10, CIS, PTES), CWE and suggested severity
- the description and the reference links, which go to the source methodology
- a status dropdown, plus Tested and N/A buttons for the two common answers
- a notes and evidence box, saved on blur or
Ctrl+S - the findings already tagged for this check, and a one-line form to log another
Next untested at the bottom moves to the next unresolved check in the current filter, so the page can be worked as a queue.
Marking a check not_applicable counts as resolved. Use it. “We looked and
there is no file upload here” is a real testing outcome, and it belongs in the
record rather than in the untested pile forever.
Quick-logging a finding from a check
The form at the bottom of the check pane takes a title and a severity and
creates a finding tagged with both asset:<value> and check:<code>. Severity
is pre-filled from the check’s suggested severity and the check’s CWE is
copied over. You are then taken to the finding detail page to fill in the rest.
Those two tags are why the finding then appears under this check and on the asset’s Findings tab.
Observations
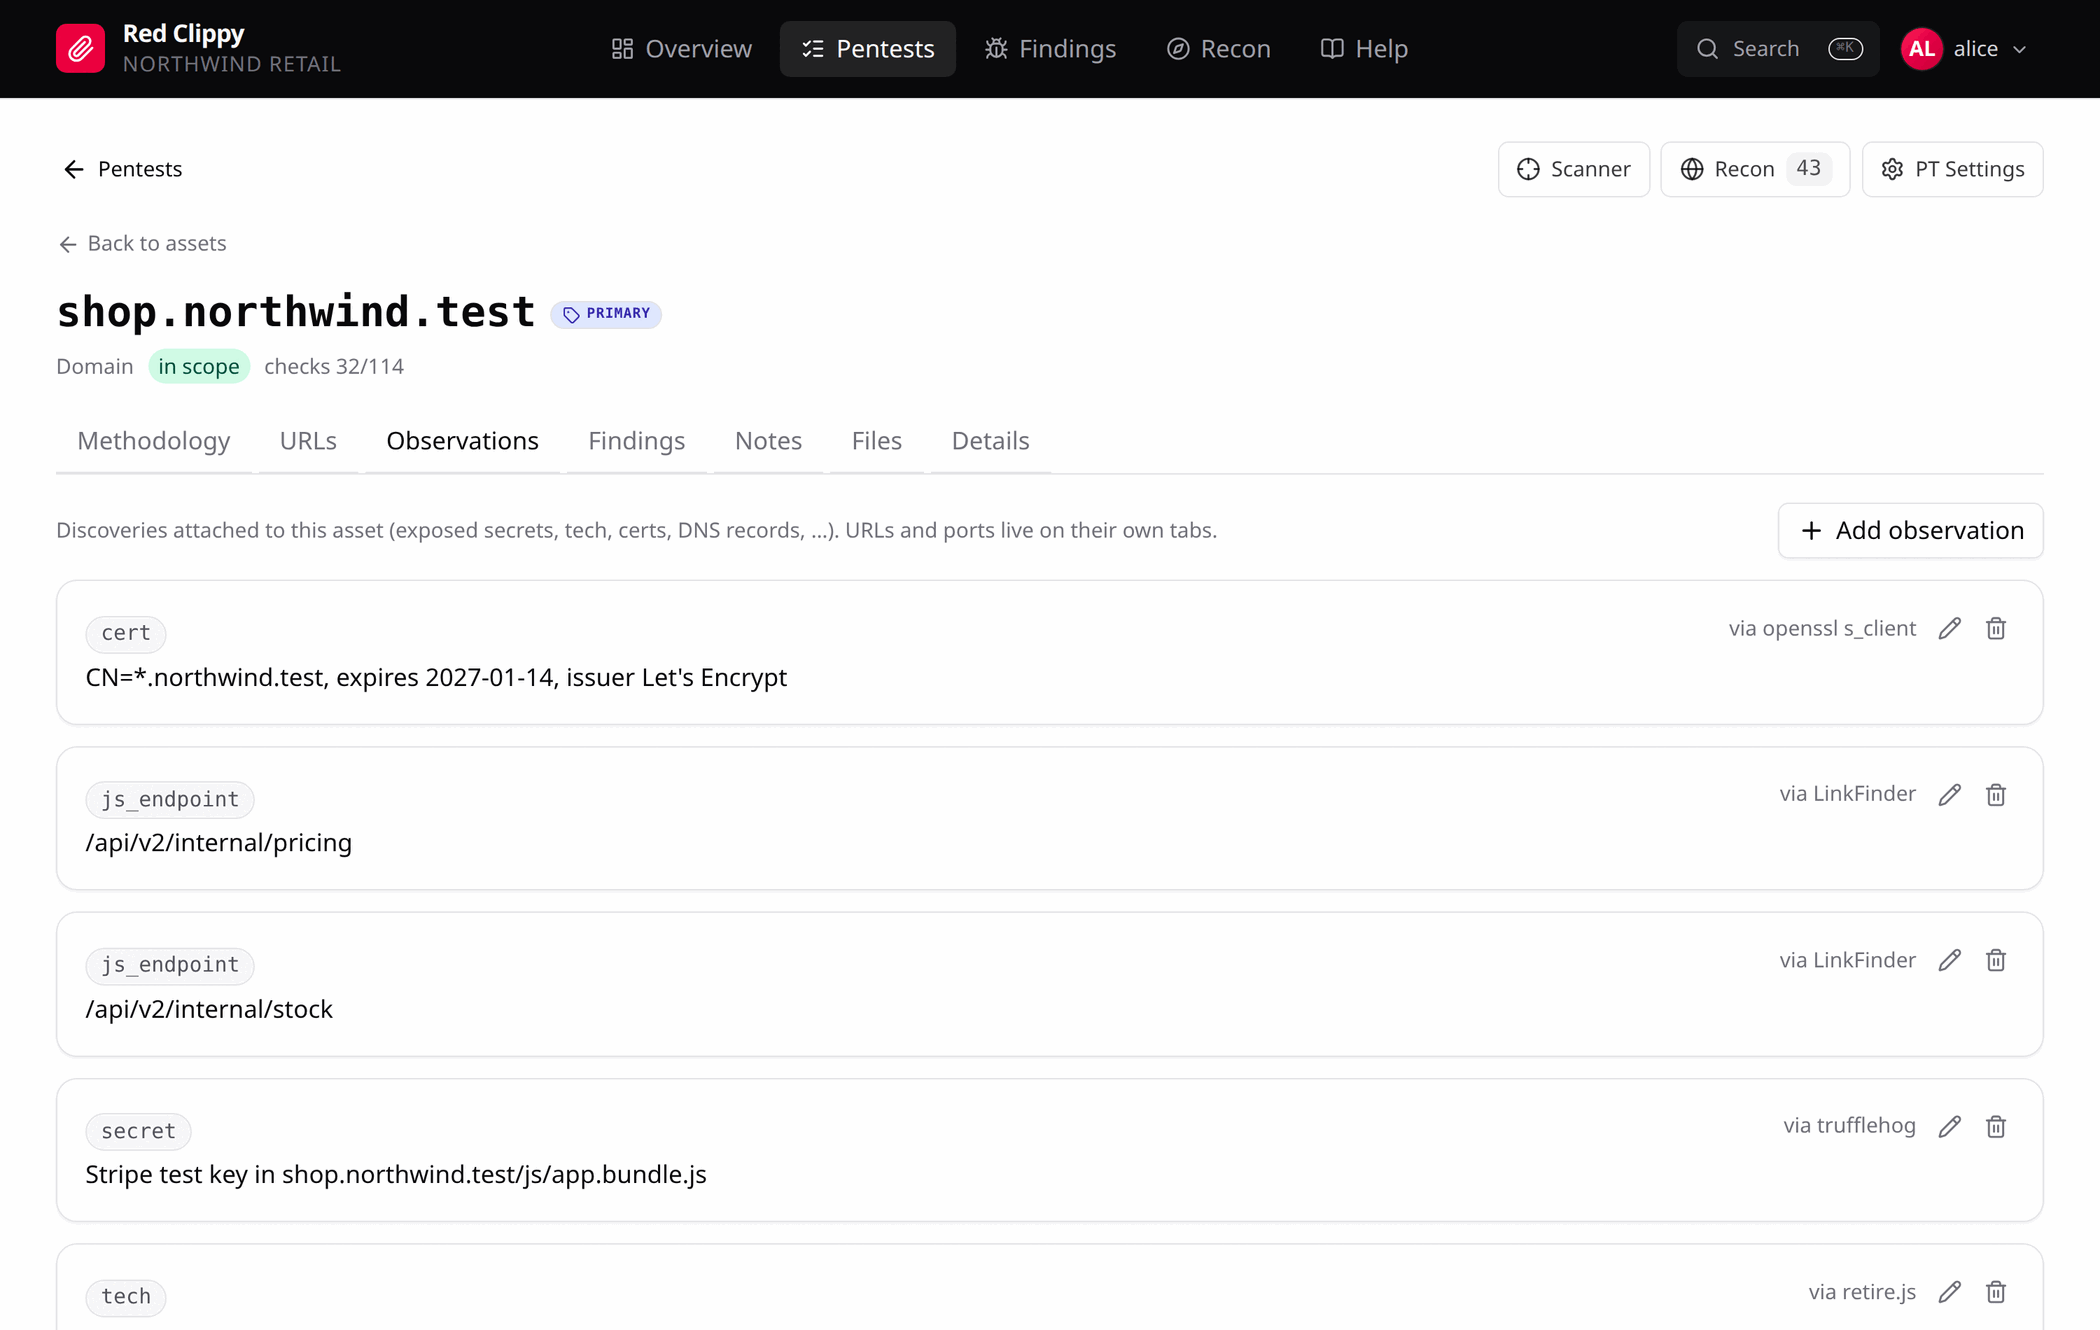
This tab holds everything discovered about the asset that is not a URL, a port or a finding. Each row shows its kind, its value and the source you recorded, and can be edited or deleted in place. Add observation takes a kind, a value and an optional source.
Content discovery output, technology fingerprints, certificates, DNS records,
leaked secrets and takeover candidates all belong here. Keeping them out of the
asset list is why one ffuf run does not make the scope list unusable.
URLs
For a domain or URL asset, the URLs tab lists paths discovered under it, with search, pagination, bulk import and export.
Additions are validated against the asset they are being added to. A URL whose host does not match, or whose path falls outside a path-scoped asset’s prefix, is rejected with a message telling you where it does belong. Without that check, URLs land under an asset they will never be attributed to and quietly disappear.
Import from previous PTs pulls the URLs recorded for this same host in the organization’s earlier engagements, grouped by the engagement they came from and excluding anything already present here. On a repeat client this saves re-running content discovery to find the paths you already know about, and it shows you at once whether a path you reported last round is still there.
Endpoints
An api asset gets a structured catalogue of operations instead of a flat URL
list.
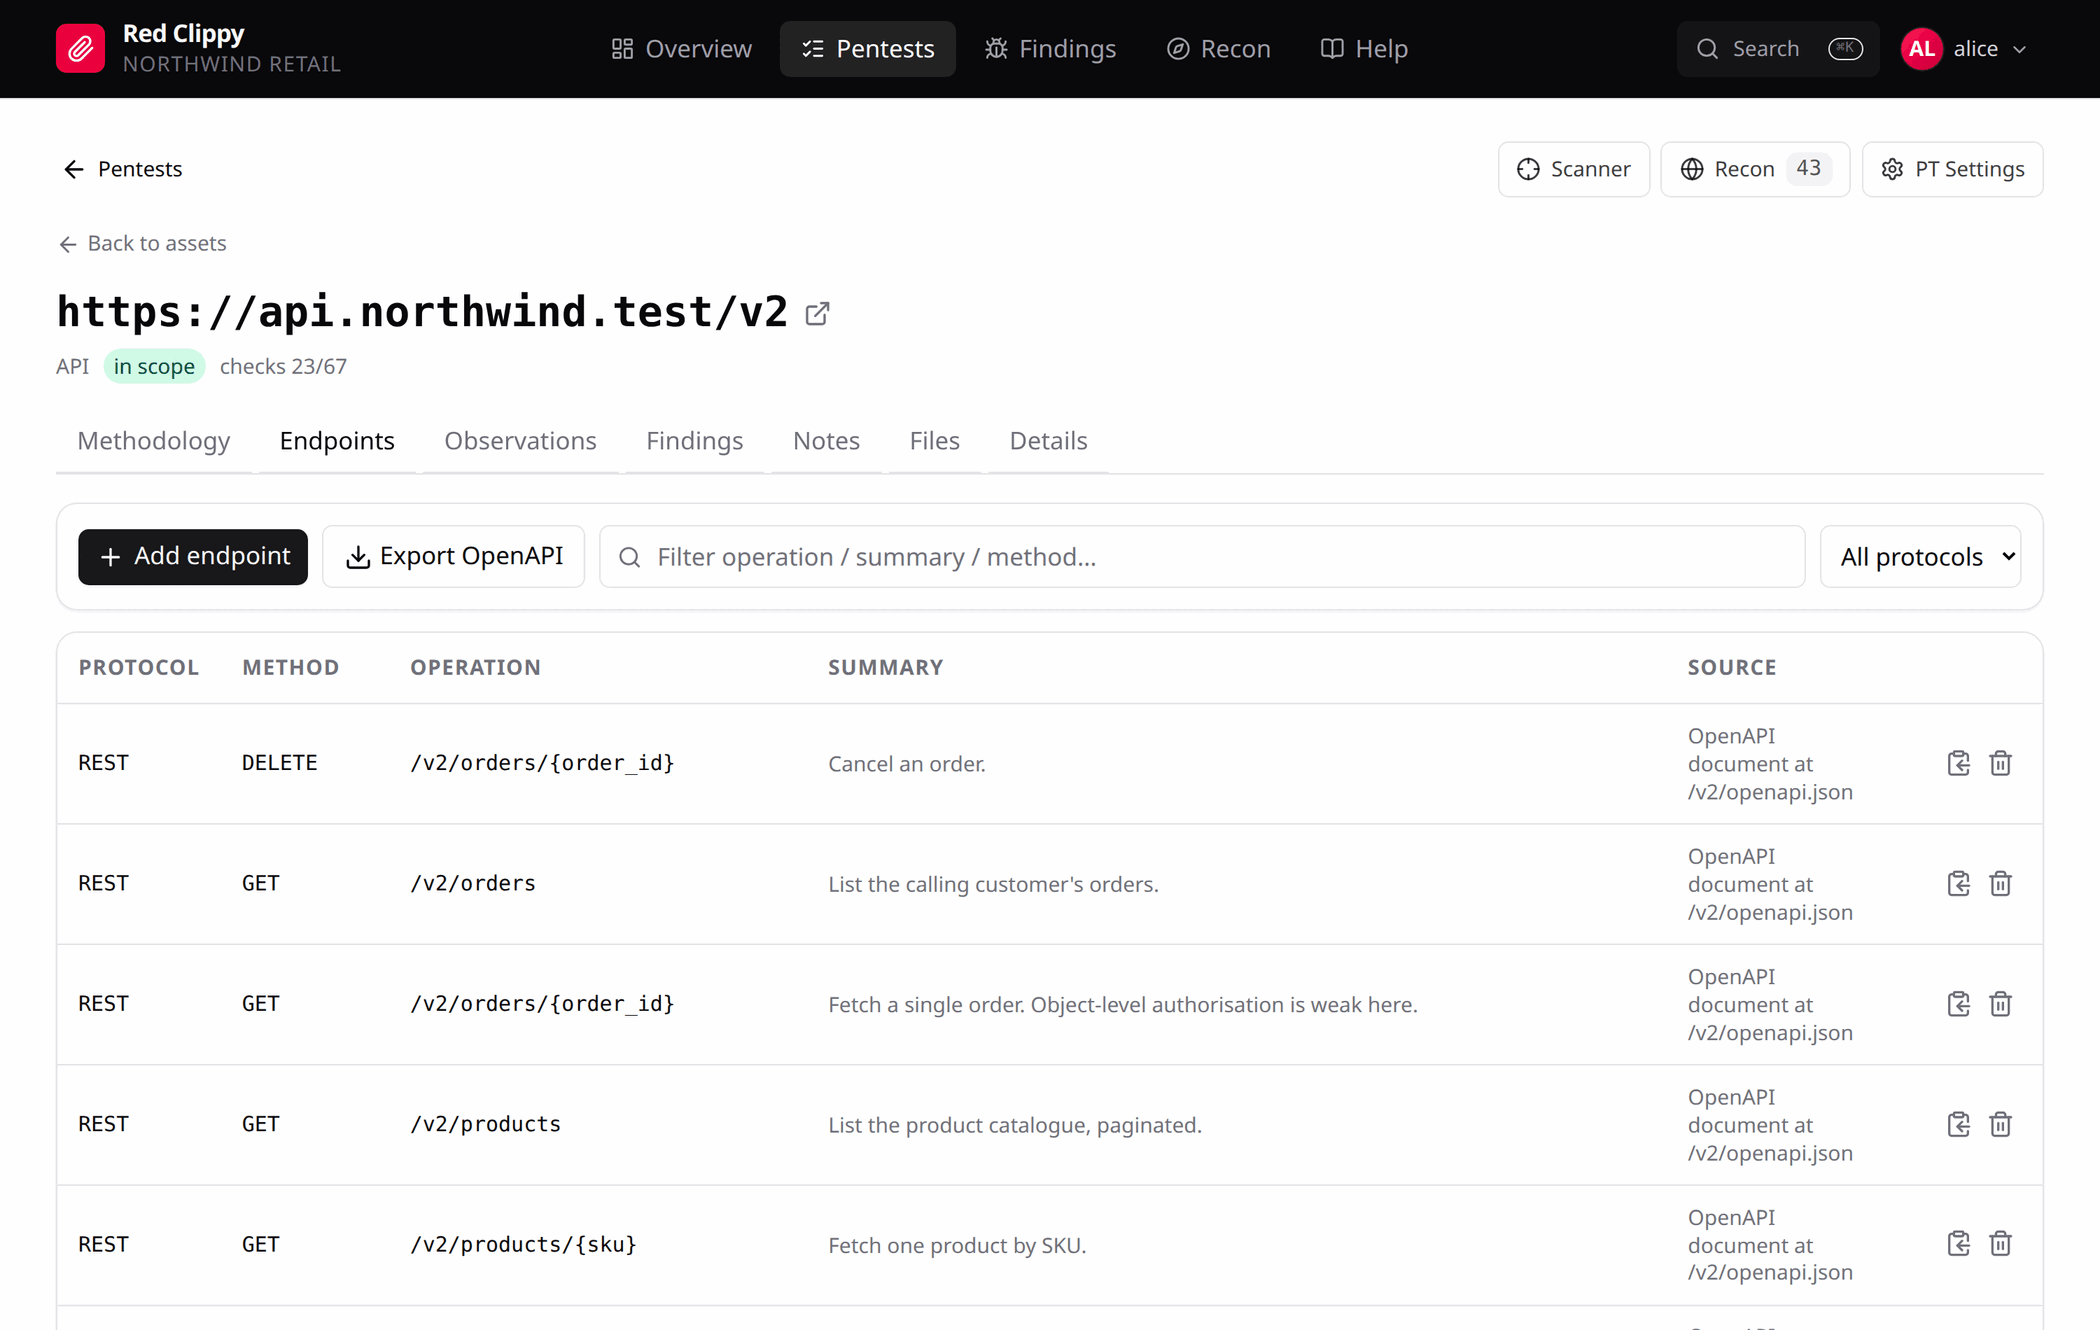
Each row carries protocol (REST, GraphQL, SOAP, gRPC), method, operation path, summary and source, and can hold query parameters, headers, and request and response bodies. The icons at the end of a row copy the endpoint as a cURL command or delete it.
Export OpenAPI produces an OpenAPI document for the whole asset, which is useful for feeding the API into another tool. Add endpoint adds one by hand. The REST API and MCP both have a bulk call for importing a whole specification at once.
Ports, Notes, Files, Details
Ports appears on IP assets and lists what is open on that host. Adding or editing a port matches on host, port and protocol, so re-importing a scan updates the existing rows instead of duplicating them.
Notes is a per-asset text area. Files is the asset’s slice of the engagement file area, with the same browser as the Files tab. Details is covered in Scope and assets.