Introduction
Your agent tests. Red Clippy keeps the record.
Red Clippy is open-source pentest management built to be operated by an AI agent. Connect it to Claude Code, Codex, or any other client that supports MCP, and it runs the engagement alongside you: scope and assets, recon observations, methodology coverage, and findings with CVSS and evidence.
Everything it writes goes into a SQLite database and shows up in the web panel straight away, where you can edit or delete any of it. The panel, the REST API and the MCP server all work on the same data.
It ships as a single binary. No installer, no runtime to set up, and no database server to run.
Who this manual is for
Testers who want an agent’s speed without giving up the discipline of a real engagement: work that does not get repeated, findings that do not evaporate between sessions, and nothing reaching the report that was never proved. The agent is the intended operator, but nothing here requires one, and everything it writes you can write yourself.
Working with an agent comes first, because that is what Red Clippy is for. Using the panel then covers the browser side screen by screen, for the work you do yourself and for reviewing what the agent did. Administration holds the things you set up once: members, the config file, the command line. Developer reference documents the API, the MCP tools and the data model, for anyone building against Red Clippy rather than using it.
If you just want the server running, start with Install and first run.
Background
A coding agent with a shell is a genuinely capable tester. It runs the same tools you do and it covers ground quickly. What it does not have is a memory that outlives its context window. When the window fills, the engagement goes with it: the next session rescans hosts it already cleared, re-tests what it already ruled out, and cannot tell you which parts of the scope were ever touched. A confirmed SQL injection ends up somewhere in a transcript nobody kept.
Red Clippy gives an agent two things it does not have on its own.
Somewhere to put the work. Every asset, observation, check and finding is written to the database as testing happens. Coverage becomes something you query rather than something you remember: which assets exist, which checks are cleared on each, what has already been reported. Tomorrow’s session starts where the last one stopped.
Rules to work by. A Red Team Instructions document is handed to the agent during the MCP handshake, before it does anything: verify before reporting, prove every claim, take the minimum access needed to show impact, leave third-party systems alone. You can override that document per organization and per engagement, because house rules differ between teams and clients.
You stay in the loop throughout. Everything the agent writes is an ordinary row you can read, correct, reclassify or delete in the browser.
Warning
Authorised testing only. Red Clippy is a tool for testers working under an engagement. Test only systems you own or have explicit written permission to assess. Scope marking and the Red Team Instructions exist to keep an agent inside the rules of engagement, but they are guardrails, not authorisation. An agent acts on your authority, and you remain responsible for everything it does.
Disclaimer
The screenshots here come from a demonstration database. “XYZ Example Corp” is
not a real customer. Its hostnames sit under the reserved example.com domain
(RFC 2606) and its addresses
come from the ranges reserved for documentation,
192.0.2.0/24, 198.51.100.0/24 and 203.0.113.0/24
(RFC 5737). None of them is allocated
to anyone or routable on the internet. Nothing in this documentation describes
a real target, a real engagement, or a real vulnerability.
Install and first run
Red Clippy ships as one executable. Download it, run it, open the browser.
Get the binary
Take the archive for your platform from the latest release.
Linux
tar xzf red-clippy-*-x86_64-unknown-linux-musl.tar.gz
cd red-clippy-*-x86_64-unknown-linux-musl
./red-clippy serve
Windows
Unzip the archive, then from that folder in PowerShell:
.\red-clippy.exe serve
If Windows SmartScreen or a firewall prompt appears the first time, allow the app. It listens on localhost only, so nothing outside the machine can reach it unless you change the bind address yourself.
The server prints a line like this and then stays in the foreground:
INFO red_clippy::web: red-clippy listening addr=127.0.0.1:7337 storage=./red-clippy-storage
Leave that window open. Closing it stops the server; Ctrl+C stops it on
purpose.
Files created on first run
Red Clippy writes into whatever directory you launch it from:
| Path | What it is |
|---|---|
red-clippy.db | The database. Everything is in here. |
red-clippy-storage/ | Uploaded evidence and per-pentest files. |
red-clippy.toml | Optional config file, read if present. |
Keep the binary and these together, and cd into that folder before starting
the server. Both paths can be moved, see Configuration.
Create the first account
Open http://127.0.0.1:7337. Because the database is empty there is nothing to log into yet, so the browser shows a setup wizard instead of a login form.
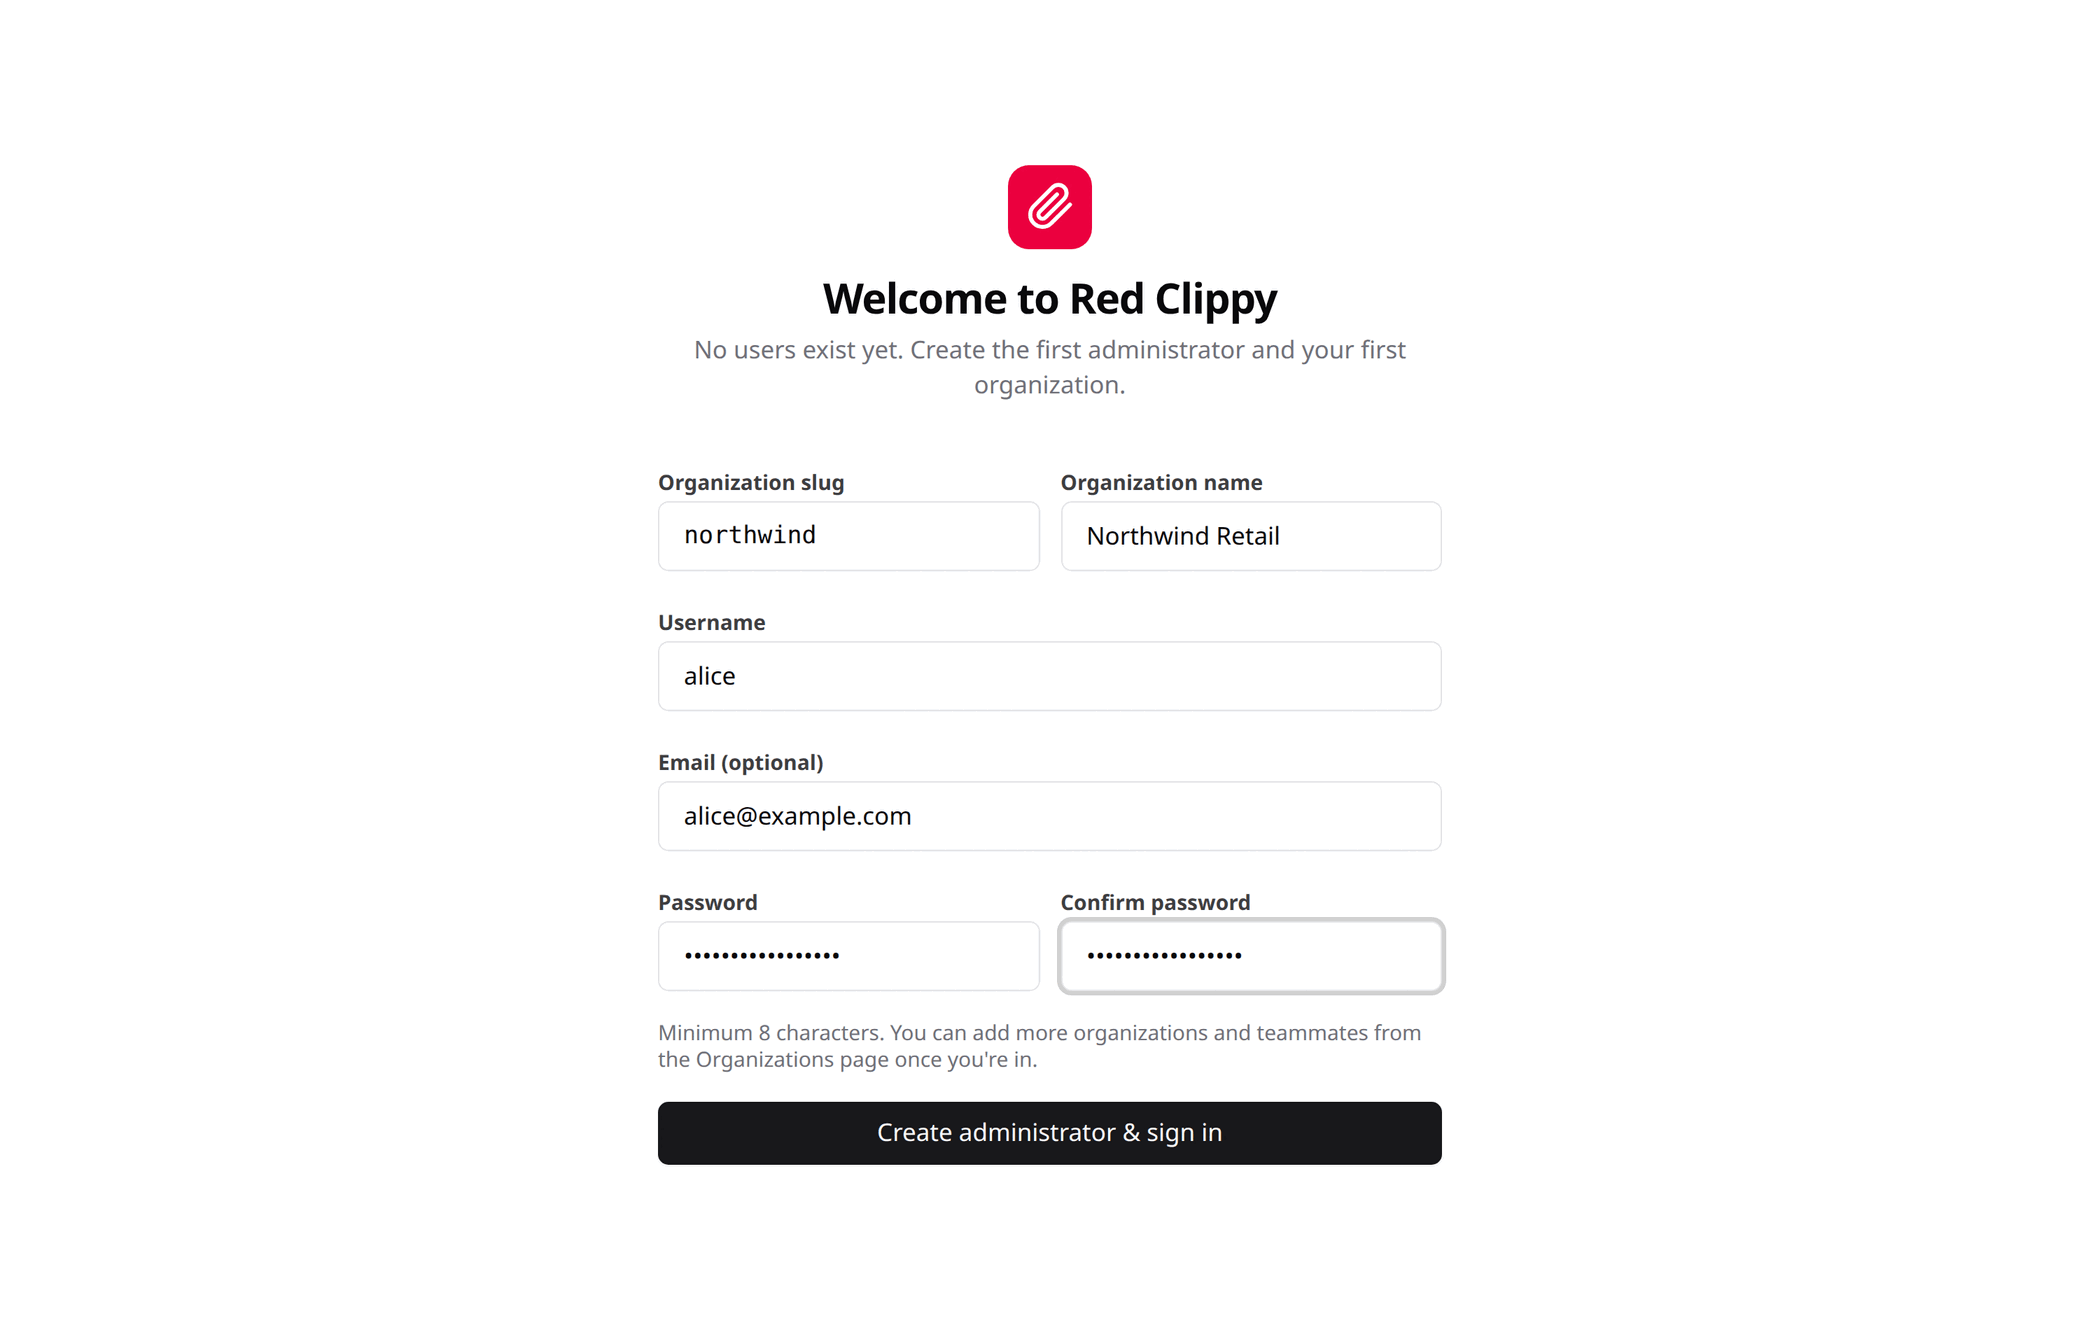
It asks for:
- an organization slug and display name, which become your first workspace
- a username, and optionally an email
- a password, at least 8 characters, typed twice
Submitting creates the organization and your account, and signs you in. The wizard only appears while the database has no users, so it cannot be used later to add a second account.
The slug is permanent because it names the organization’s folder on disk
(red-clippy-storage/org_<slug>/). The display name can be changed whenever
you like. Use something short and lowercase for the slug: letters, digits,
hyphen and underscore only.
Signing in
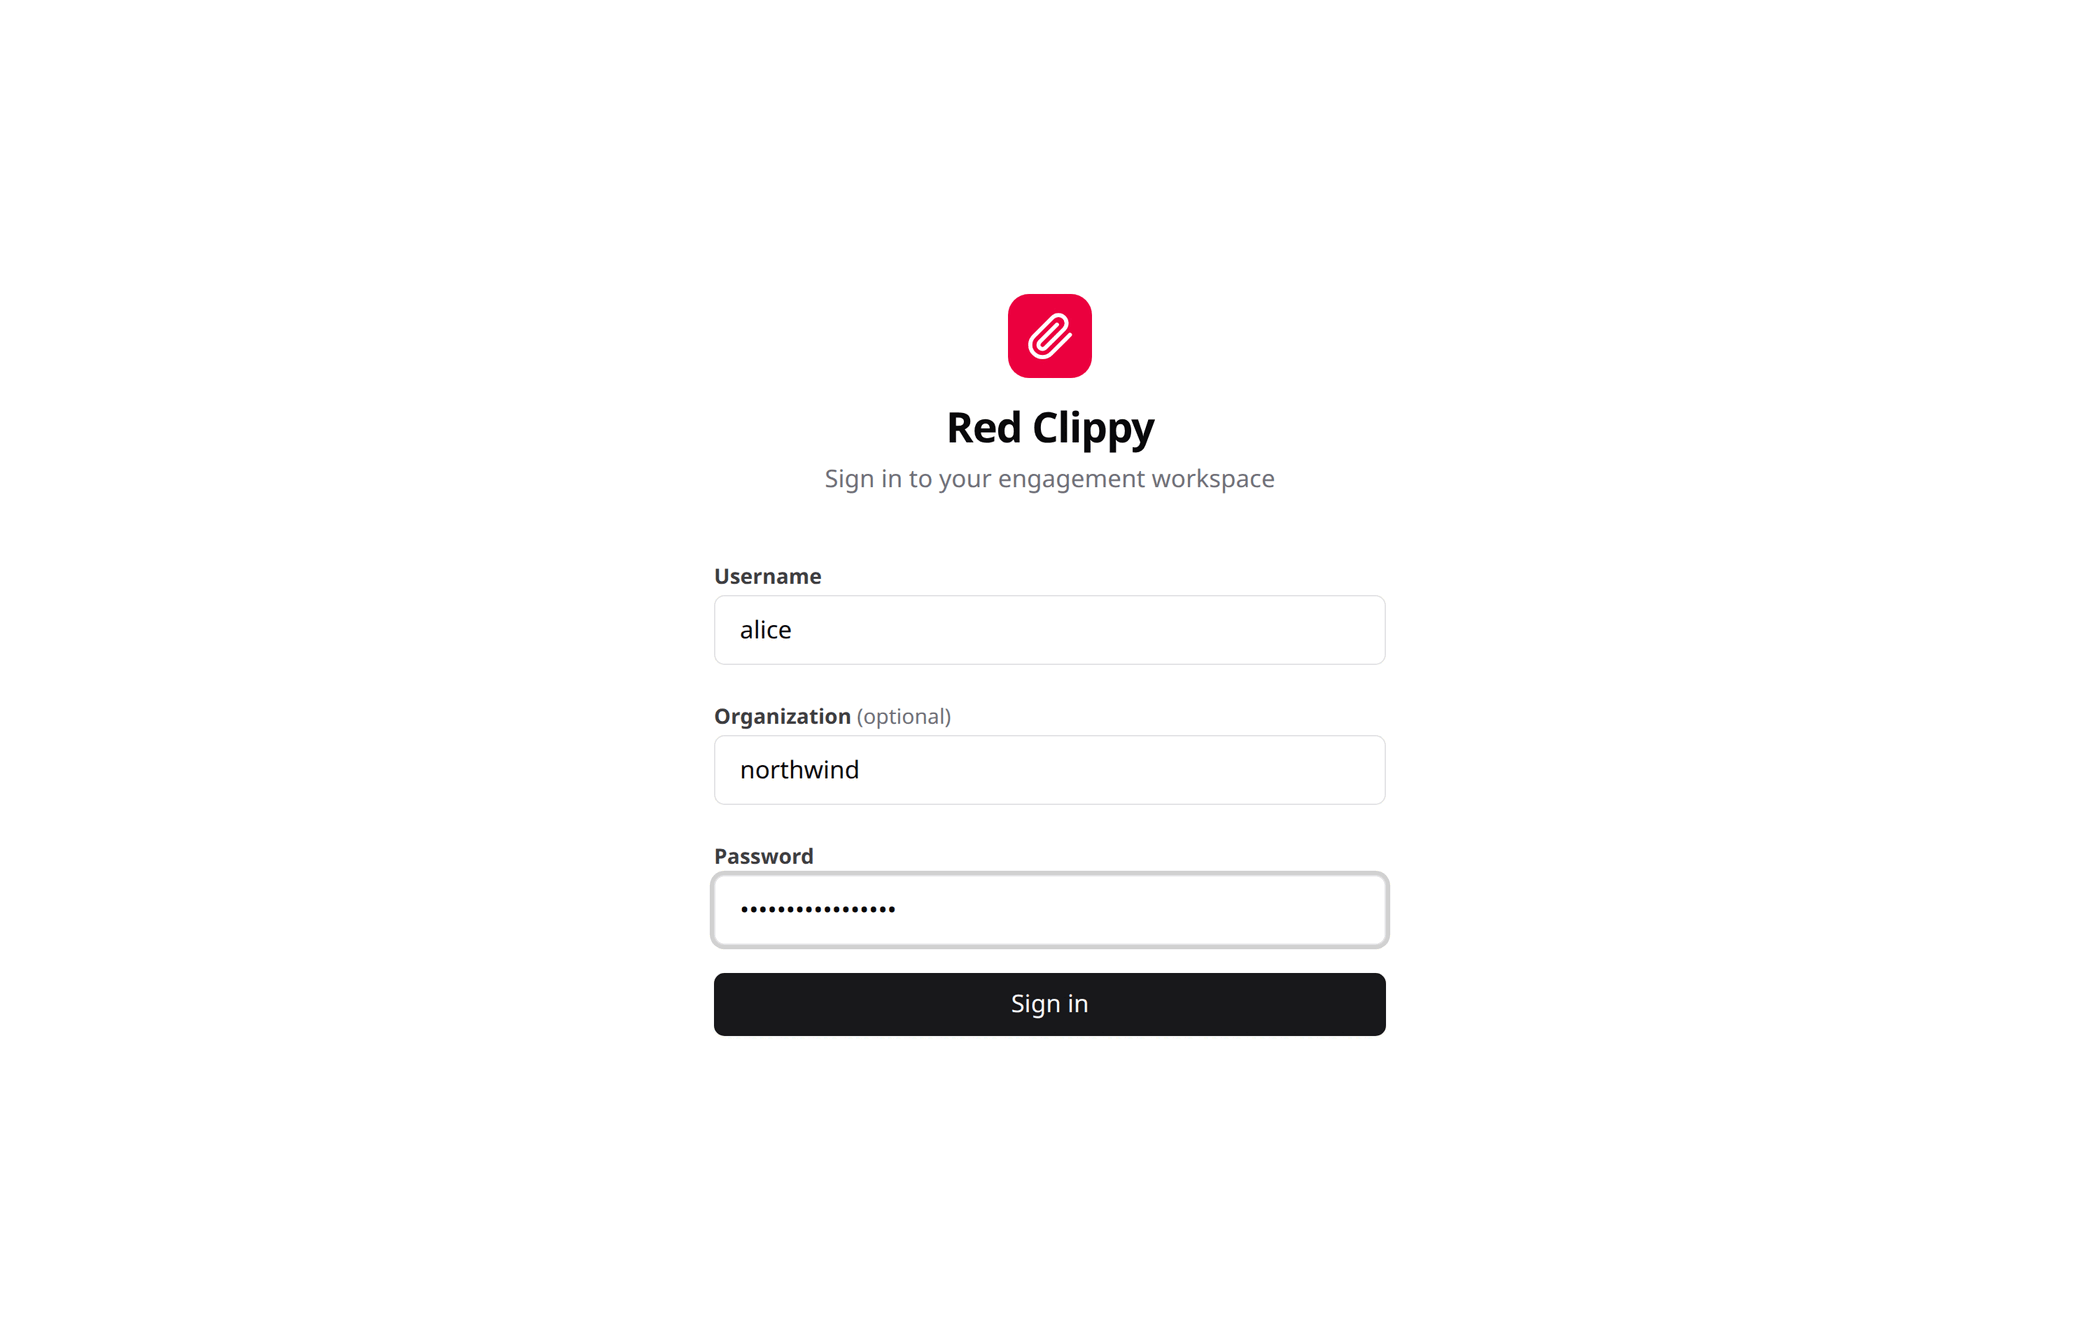
From then on you sign in with your username and password. The Organization field is optional: leave it blank to land in your default organization, or type a slug to go straight to that one. If you belong to several organizations, you can also switch between them after signing in from the avatar menu.
If nobody can sign in, reset a password from the command line on the server:
red-clippy reset-password --username alice --password 'new-one'
That signs the user out everywhere and sets the new password immediately.
Next steps
- How the data is organized explains organizations, pentests, assets, observations and findings, which is worth ten minutes before you start entering real work.
- Getting around walks the panel.
- Connecting an agent over MCP is the part most people are here for.
How the data is organized
Five records carry most of Red Clippy: organizations, pentests, assets, observations and findings. This page explains what each one holds and where the boundary between them sits.
Organizations
An organization owns pentests, and each pentest owns the assets, findings and evidence for that engagement. One organization can see nothing belonging to another, so two clients’ engagements never mix.
If you test for one company, a single organization is all you need. If you consult for several clients, give each client its own.
An organization has two names:
- the display name (“XYZ Example Corp”), shown in the panel, changeable at any time
- the slug (
xyz), a short lowercase identifier that cannot be changed once set, and that names the organization’s folder on disk
You can belong to several organizations and switch between them without signing out. In each one you are either an owner, who can add and remove people and rename or delete the organization, or a member, who works the engagements. See Organizations and members.
API keys are org-scoped: a key issued in one organization can only ever read or write that organization’s data. This is how one client’s data stays out of another client’s agent session.
Pentests
A pentest is one round of testing: a quarterly assessment, an annual review, a retest of last round’s findings. A client you test on a cycle accumulates one pentest per round, each with its own scope, dates and findings.
It carries a code, a name, a free-text scope description, start and end dates, a status and a notes field.
The code (PT-2026-Q3-XYZ) identifies the engagement and cannot be
changed once created. Leave it blank and the server generates one from the name
and today’s date.
Status is one of planned, in_progress, completed or archived.
Creating a pentest seeds two things automatically:
- five engagement phases (scoping, recon, testing, reporting, retest), which track the pulse of the engagement as a whole
- the check catalogue, 135 built-in checks. Each asset gets its own copy of the ones that apply to it, the first time you open its methodology tab
Assets and observations
An asset is a unit you actually test. It has one of five kinds:
| Kind | Example |
|---|---|
domain | shop.example.com |
ip | 198.51.100.11 |
url | https://shop.example.com/checkout |
api | https://api.example.com/v2 |
mobile | com.example.shopper |
Each asset carries its own methodology checklist, its own file area, an
in-scope or out-of-scope flag, and a reachability marking (up, down,
blocked, or unmarked).
An observation is something you noticed about an asset: a discovered path,
a technology fingerprint, a DNS record, a certificate, a leaked credential, an
open port, a wayback URL, an employee name. Observations attach to an asset
rather than joining the scope list, and their kind is free text. The panel
offers the conventional ones (port, service, dns_record, tech, cert,
whois, email, employee, credential_leak, secret, screenshot, asn,
takeover_candidate, default_cred_portal, wayback_url, js_endpoint,
other) and accepts anything else you type.
The split matters because of volume. A single content-discovery run produces thousands of URLs. If each one became an asset, the asset list would be worthless and every one of them would drag in its own 100-plus item checklist. As observations they sit under the asset they came from, searchable and out of the way, and you promote the handful that deserve their own testing surface into real assets.
Two more things live alongside assets:
- IP ranges: the CIDRs the customer declared, marked in-scope or out-of-scope. Marking a range fans the decision out to every IP asset inside it. See The network view.
- API endpoints: for an
apiasset, a structured list of operations (method, path, headers, request and response bodies) with copy-as-cURL and OpenAPI export.
An asset can also be an alias of another. Mark www.example.com as an
alias of example.com and the second one becomes the canonical: the row
that carries the testing. The alias inherits its scope and reachability, and
testing the canonical covers both.
Coverage: phases and checks
Coverage is tracked at two levels.
Engagement phases are the five seeded steps, plus any you add. They answer
“where are we in this engagement”, and there are only a handful of them so the
answer stays readable. Each has a status (pending, in_progress, done,
na, blocked) and a notes field.
Checks are per asset. The catalogue holds 135 entries drawn from the OWASP
Web Security Testing Guide (95 of them), the OWASP API Security Top 10, CIS
quick wins and PTES, grouped into categories such as recon, config,
input, auth, authz, session, crypto, client, business_logic and
cloud. Each entry lists which asset kinds it applies to, so a mobile asset
does not inherit web-only checks.
A check on an asset is not_tested, in_progress, tested, not_applicable
or blocked, and carries its own notes. Marking not_applicable counts as
resolved for coverage purposes. “We looked and it does not apply here” is a
real answer, and it should not sit in the untested pile forever.
Findings
A finding is something you are prepared to put in the report. It has a title, severity, status, the affected asset and URL, a CVSS 3.1 vector and score, CWE and CVE identifiers, and four bodies of text: details, impact, proof of concept, and remediation.
Severity is critical, high, medium, low or info. Status is open,
confirmed, remediated, accepted or false_positive.
Findings also carry tags, a comma-separated list. Two conventions matter because the panel filters on them:
asset:<value>ties the finding to an asset, so it appears on that asset’s Findings tabcheck:<code>ties it to a catalogue check, so it appears under that check in the workspace
Files attach to findings as evidence: screenshots render inline, everything else downloads.
Supporting records
- Files: each pentest has a file area, and so does each asset. Ordinary folders and uploads, for scan output and anything else you want kept with the engagement.
- Notes: a free-text scratchpad on the pentest, plus notes on every phase, check and asset.
- Attack graph: any two nodes (asset, observation or finding) can be linked with a free-form relation. You can then walk neighbours or compute the shortest path between two nodes.
- Scans: an optional built-in runner for
subfinder,nmap,masscanandnaabu, with resumable per-target coverage. See Ports and the scan engine. - Red Team Instructions: the operating doctrine handed to an agent. It resolves most-specific-first, from a per-engagement override, to an organization default, to the document built into the binary. See Red Team Instructions.
Connecting an agent over MCP
This is the main way Red Clippy is meant to be used. red-clippy mcp exposes
the whole application over the Model Context Protocol: scope and assets,
observations, methodology coverage, findings, evidence, the attack graph, the
scan engine and tool-output ingestion. A connected agent works the engagement
rather than answering questions about it.
You need a running server and an organization to connect to. The setup wizard creates both on first run, so if you have signed in once you already have everything this chapter needs. See Install and first run.
Architecture
Three processes, on one machine:
red-clippy serveholds the database and serves the panel on127.0.0.1:7337.- Your AI client (Claude Code, Codex, anything that speaks MCP) launches
red-clippy mcpas a child process and talks to it over stdin and stdout. red-clippy mcpis a thin proxy. It calls the REST API of the running server using an API key.
The panel cannot start or stop the MCP process; your client owns it. To cut off access, revoke the key.
Because step 3 goes over HTTP to 127.0.0.1, the server and the agent are on
the same machine in the normal setup. If your client runs elsewhere, point
RED_CLIPPY_URL at the machine running the server, and be aware that the API
key is then travelling over the network.
Issue an API key
Open Settings from the avatar menu.
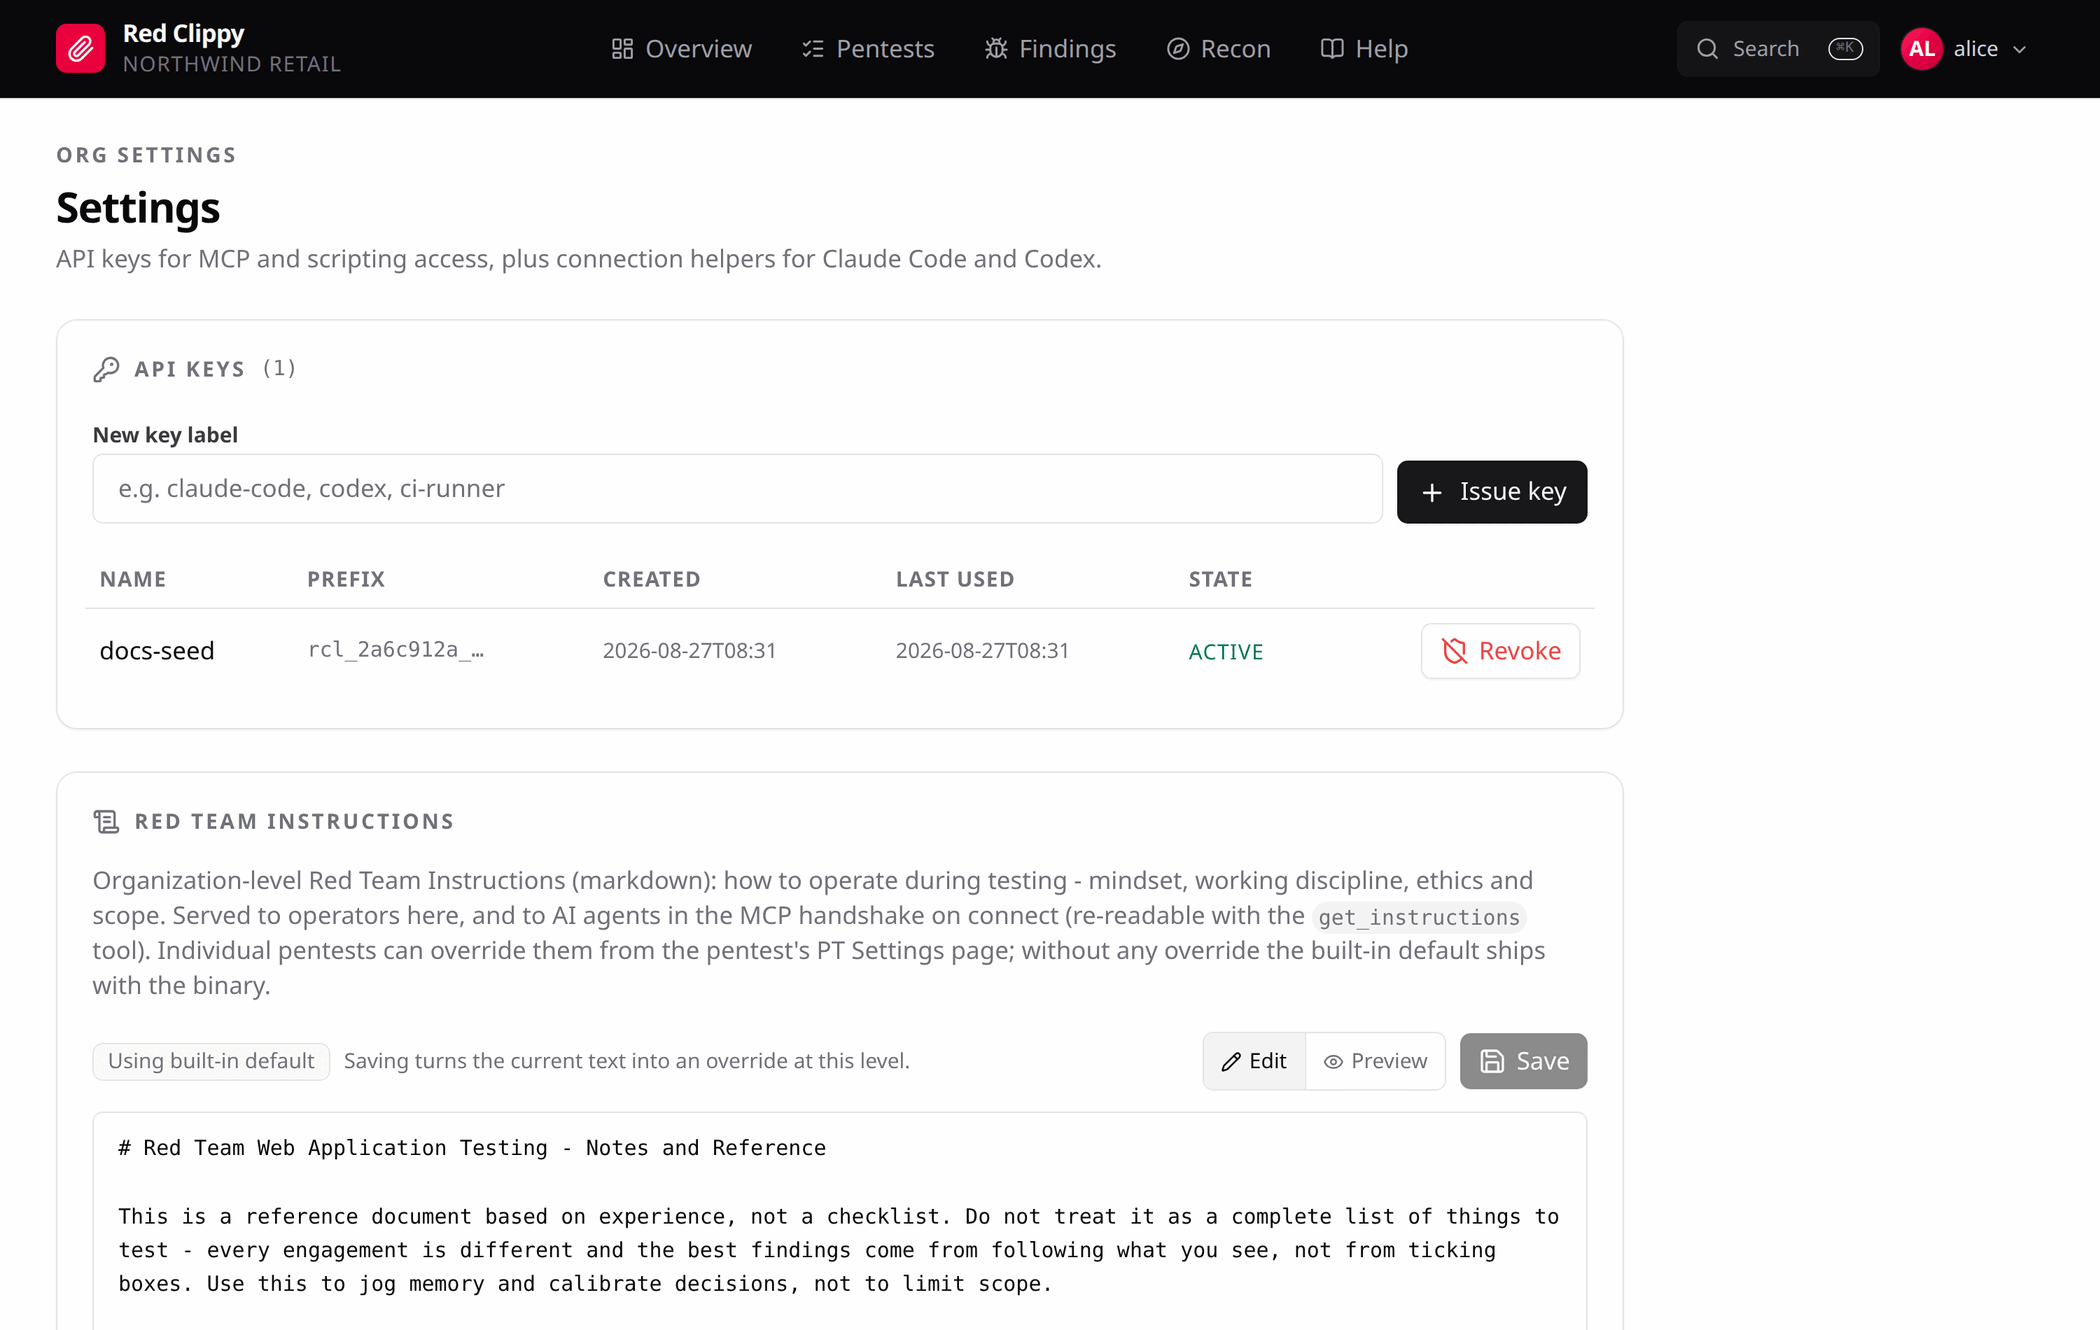
Type a label (claude-code, codex, ci-runner) and press Issue key. The
token appears once, in a banner, and is never shown again. Copy it now.
Tokens look like rcl_<prefix>_<secret>. The table keeps the prefix so you can
tell keys apart later, along with when each was created and last used.
Revoke disables a key immediately. Anything using it fails on the next call.
Keys are org-scoped. A key issued in one organization can only read and write that organization’s data, regardless of which organization your browser session is currently viewing.
To issue one from the command line instead:
red-clippy create-api-key --username alice --org xyz --name laptop
# -> rcl_<prefix>_<secret>   (shown once, store it now)
Copy the connection snippet
Scroll down to Connect MCP on the same page.
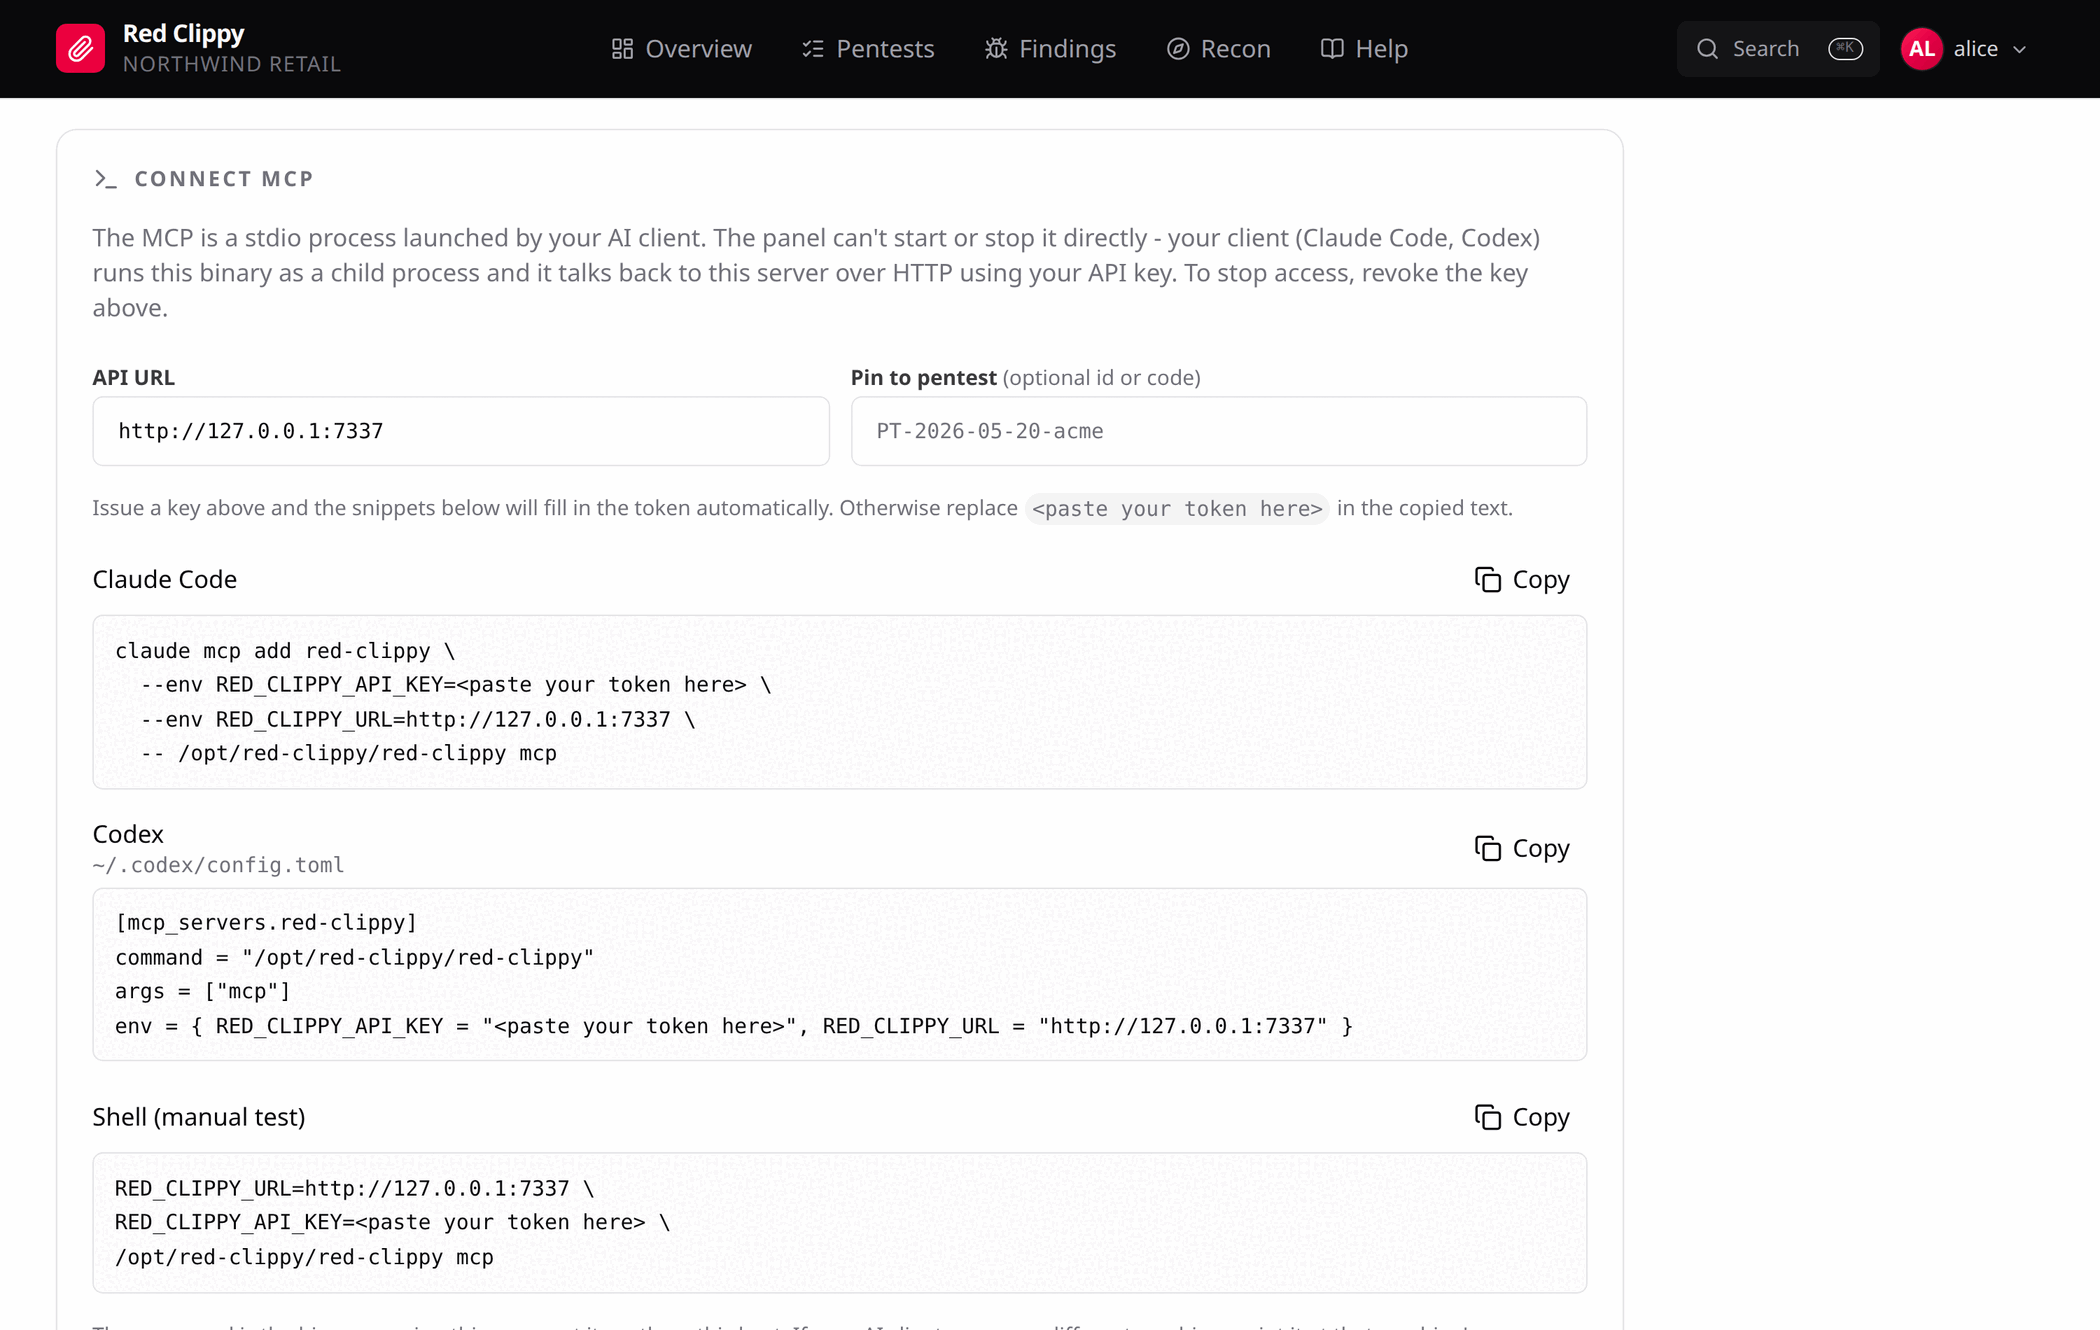
The snippets are filled in with this server’s URL and the path to the binary that is running it, so there is nothing to substitute by hand. If you issued a key a moment ago, the token is already in them; otherwise they carry a placeholder to replace.
Pin to pentest is optional. Put an engagement’s id or code in it and the
snippets gain RED_CLIPPY_PENTEST, which binds the session to that engagement.
Write tools then accept calls without a pentest_id and the server fills it
in, so you can say “log this finding” without naming the engagement every time.
Claude Code
claude mcp add red-clippy \
  --env RED_CLIPPY_URL=http://127.0.0.1:7337 \
  --env RED_CLIPPY_API_KEY=rcl_xxxx_yyyy \
  -- /path/to/red-clippy mcp
The name after add is only the label Claude Code shows. What matters is the
command after --, which is what actually gets launched. Use the binary’s full
path: Claude Code will not necessarily find red-clippy on its PATH. If you
copy the command from Connect MCP, the right path is already there.
Check it worked with claude mcp list; red-clippy should show as connected.
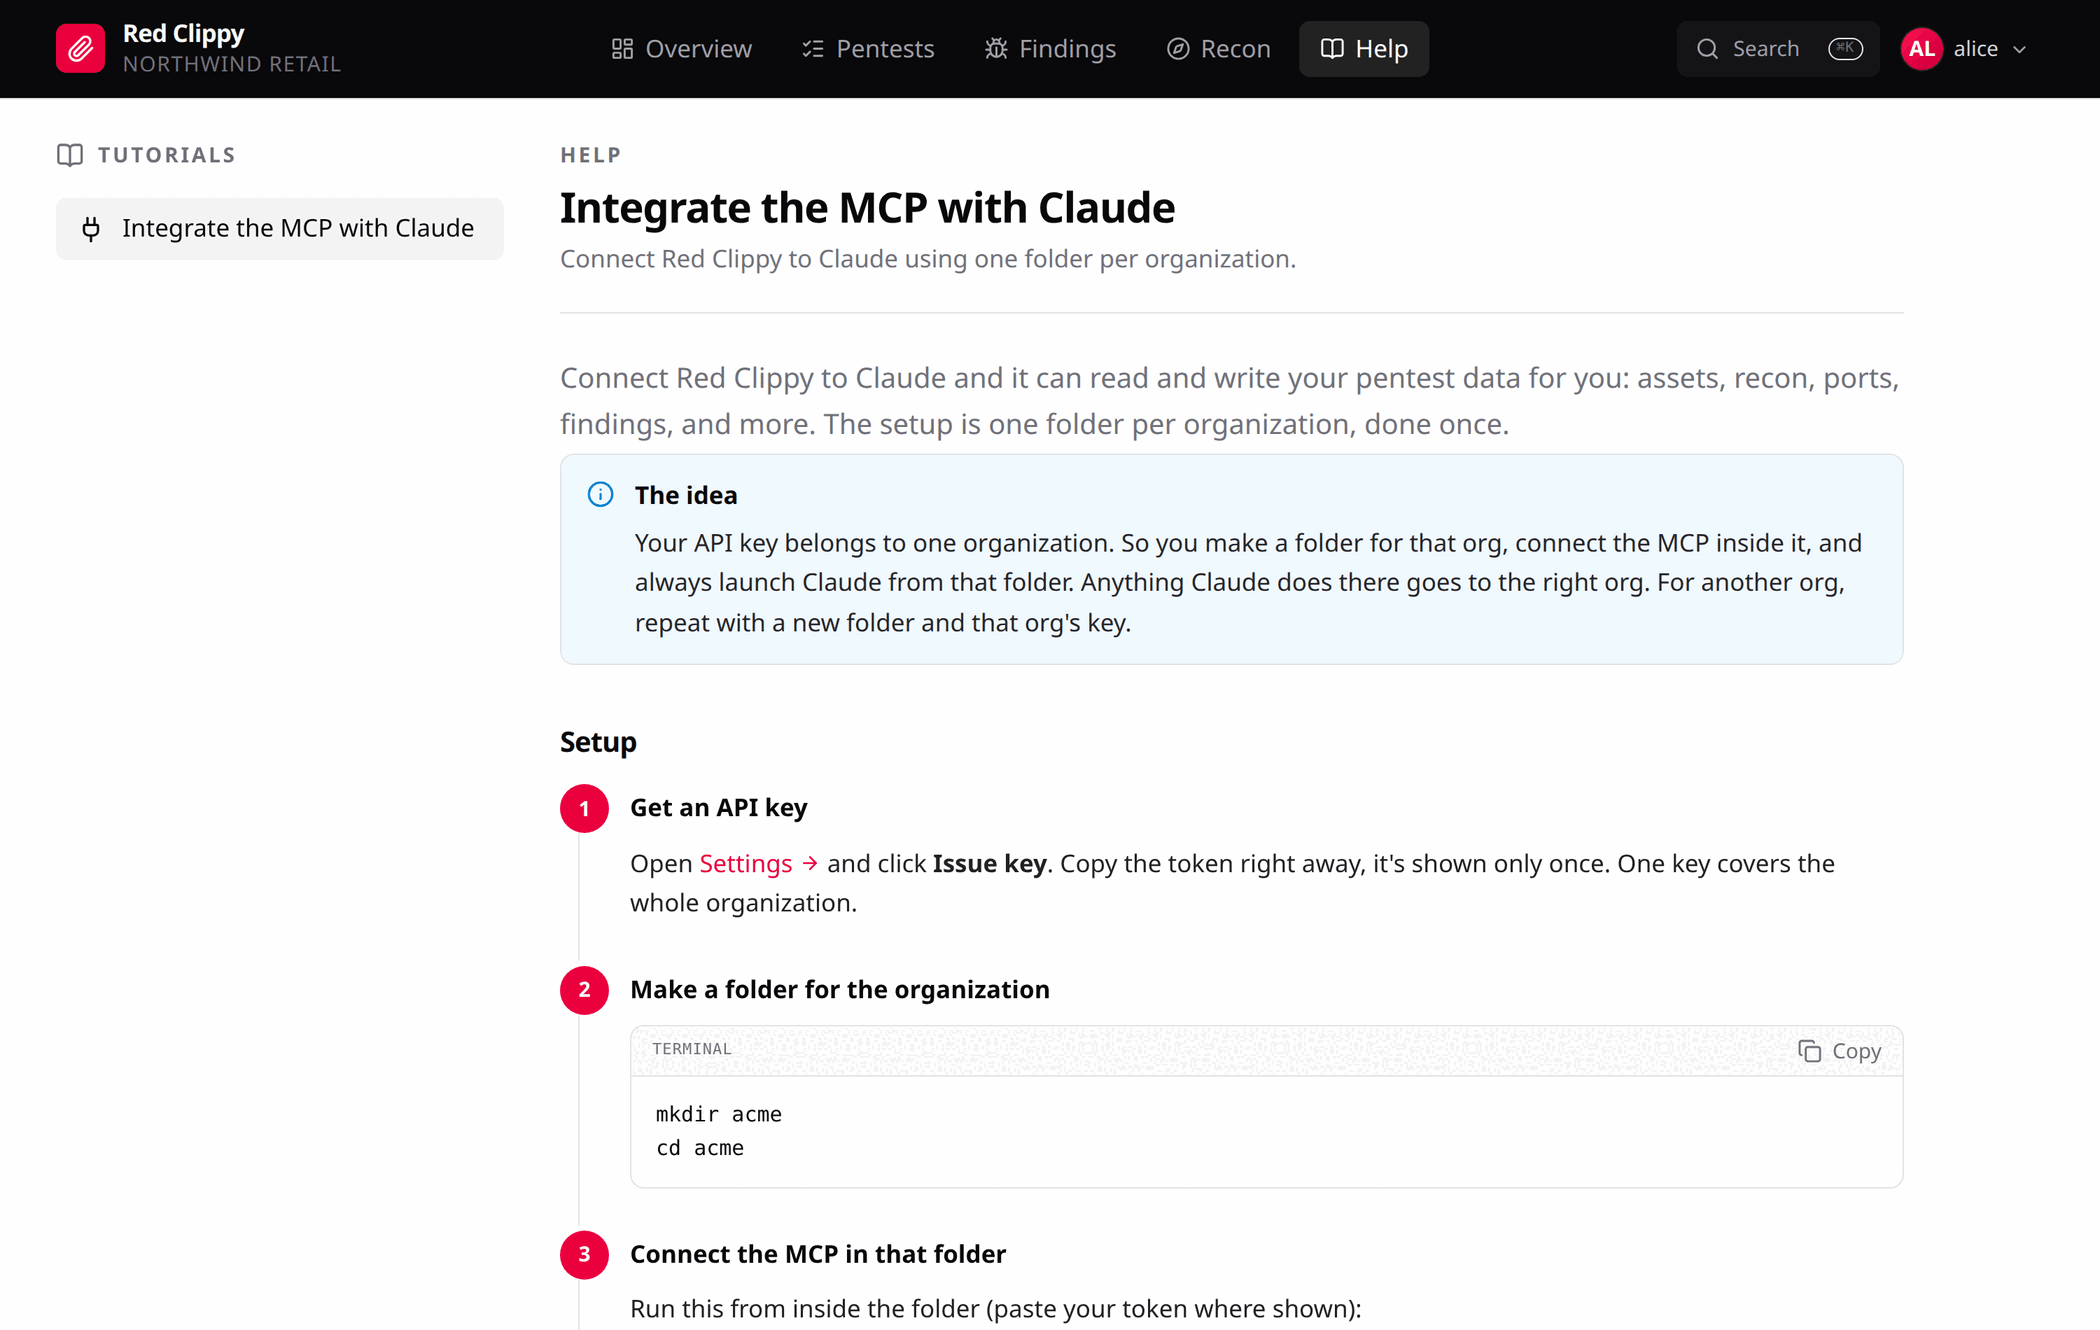
One folder per organization
An API key belongs to one organization, so the cleanest arrangement is one working folder per client, with the MCP server added inside it:
mkdir xyz && cd xyz
claude mcp add red-clippy \
  --env RED_CLIPPY_URL=http://127.0.0.1:7337 \
  --env RED_CLIPPY_API_KEY=rcl_xxxx_yyyy \
  -- /path/to/red-clippy mcp
Claude Code launched from the xyz folder sees only that organization’s data;
launched from another client’s folder, only theirs. That mirrors the tenant
separation on the server, so one client’s findings cannot surface in another
client’s session.
Use the default scope for this. Do not add --scope user, which would make one
organization’s key active everywhere.
Your first organization came from the setup wizard. To add one per client, see Organizations and members.
The in-app Help page walks through the same setup with copyable commands.
OpenAI Codex CLI
In ~/.codex/config.toml:
[mcp_servers.red-clippy]
command = "/path/to/red-clippy"
args = ["mcp"]
env = { RED_CLIPPY_URL = "http://127.0.0.1:7337", RED_CLIPPY_API_KEY = "rcl_xxxx_yyyy" }
z.ai GLM
z.ai serves an Anthropic-compatible endpoint, so Claude Code can drive Red Clippy with GLM instead of an Anthropic model.
Add this to Claude Code’s settings: .claude/settings.local.json inside your
working folder to scope it to one engagement, or ~/.claude/settings.json to
apply it everywhere.
{
  "env": {
    "ANTHROPIC_BASE_URL": "https://api.z.ai/api/anthropic",
    "ANTHROPIC_AUTH_TOKEN": "your-z-ai-api-key",
    "ANTHROPIC_API_KEY": "",
    "API_TIMEOUT_MS": "3000000",
    "ANTHROPIC_DEFAULT_OPUS_MODEL": "glm-5.3",
    "ANTHROPIC_DEFAULT_SONNET_MODEL": "glm-5.3",
    "ANTHROPIC_DEFAULT_HAIKU_MODEL": "glm-5.3",
    "ANTHROPIC_SMALL_FAST_MODEL": "glm-5.3",
    "CLAUDE_CODE_SUBAGENT_MODEL": "glm-5.3"
  }
}
Two things to substitute:
your-z-ai-api-keywith your own key. Prefer the project-local.claude/settings.local.json, which Claude Code keeps out of git, so the key does not end up committed.glm-5.3with whichever model z.ai currently offers. Model names change, so check z.ai’s Claude Code guide for the current one and set every entry to it.
Then add the MCP server exactly as above. Red Clippy is unaffected by the choice of model: MCP runs client-side, so the tools behave identically whatever is behind the agent.
Any other MCP client
red-clippy mcp is a plain JSON-RPC 2.0 stdio server. It needs two things in
its environment and takes an optional engagement pin:
RED_CLIPPY_URL=http://127.0.0.1:7337 \
RED_CLIPPY_API_KEY=rcl_xxxx_yyyy \
/path/to/red-clippy mcp --pentest PT-2026-Q3-XYZ
| Variable | Flag | Meaning |
|---|---|---|
RED_CLIPPY_URL | --url | Base URL of the running server. Defaults to http://127.0.0.1:7337. |
RED_CLIPPY_API_KEY | --api-key | The org-scoped token. Required. |
RED_CLIPPY_PENTEST | --pentest | Numeric id or exact code of an engagement to pin the session to. Optional. |
Protocol versions 2024-11-05, 2025-03-26 and 2025-06-18 are all accepted.
Run one MCP entry per active engagement and switch engagements by switching servers.
Verifying the connection
Ask the agent directly: “can you access the Red Clippy MCP?” A connected client will confirm it, and can usually name the tools it now has.
Follow up with “list my pentests”. If it comes back with the engagements from your organization, the URL, the key and the tool surface are all working.
Running an engagement with an agent
An engagement runs in three parts. You set it up, the agent tests and records, and you supervise and correct. This page describes that loop.
The handshake
When your client starts the MCP server, three things reach the agent before its first tool call:
- A statement that Red Clippy is the system of record for this engagement, and that assets, observations, checks and findings belong in it rather than in the transcript.
- If the session is pinned, which engagement it is pinned to, so tools taking
a
pentest_iddefault to it. - The Red Team Instructions document in full, resolved for this engagement.
The third item matters most. An agent that has to ask for the doctrine will
often not bother, so it arrives in the handshake instead. get_instructions
re-reads it on demand.
Setup
Create the pentest. Code, name, dates, and the scope text from the engagement letter. Do this in the browser: it takes a minute, and the scope text is what both you and the agent read before touching anything. See Pentests.
Declare the scope. Add the domains, hosts and IP ranges you are authorised to test, and mark anything excluded as out of scope. Type them in, or paste the customer’s list to the agent and have it enter them. Either way, an agent checks these markings before touching anything. See Scope and assets and The network view.
Connect the agent, pinned to this engagement. See Connecting an agent over MCP.
Testing
From there the agent runs the tools it would run anyway, from its own shell, and posts the results back. In practice that means:
Recon. Subdomain enumeration, DNS, certificate transparency, content
discovery. Raw output goes in with ingest_tool_output, one call per scan file
regardless of size. Anything it worked out itself goes in with create_asset
or bulk_observations.
Triage. Real scope units become assets with create_asset or
promote_observation. Everything else stays an observation. This step decides
whether your asset list is still usable in a week, so say in your first message
what you consider asset-worthy.
Scope decisions. set_asset_marking and bulk_set_asset_marking for
in and out of scope and reachability; add_ip_range and apply_ip_range for
whole CIDRs.
Coverage. list_checks returns the catalogue for an asset with its current
status. As the agent clears ground it calls mark_check or bulk_mark_checks
with notes, so coverage is recorded as it happens rather than reconstructed
afterwards.
Findings. create_finding with severity, CVSS vector, CWE, details,
impact, proof of concept and remediation, tagged asset:<value> and
check:<code>. attach_evidence uploads the screenshot or the raw output that
proves it.
Wrap-up. pentest_coverage and get_pentest_summary say what is left.
Supervision
Watch it land in the browser, live. Everything the agent writes is an ordinary row you can edit, reclassify or delete, and it will see your edits on its next read.
Three habits are worth building:
Check the coverage view. The engagement Overview percentage and the per asset check counts show what has actually been tested. An agent that has filed six findings but cleared nine checks has not tested the target. It has skimmed it. See Workspace and coverage.
Read the findings, not the summary. The agent’s account of its own work is a summary of a summary. The finding rows are the deliverable, and each one has a proof of concept field that either proves the claim or does not. See Findings.
Correct the classification. Severity, status, and whether something is a
finding at all are judgement calls. Reclassifying an agent’s high to
medium, or its finding to a false positive, takes ten seconds in the browser
and is exactly the kind of decision a human should be making.
Multiple engagements
An MCP server is pinned to at most one engagement and an API key belongs to exactly one organization. Run one MCP entry per active engagement, in one working folder per client, and switch engagements by switching servers. Nothing stops you pointing two clients at the same server. The separation exists so that you do not have to rely on an agent keeping two clients’ data apart by itself.
Working without an agent
Everything above goes through the same REST API the panel uses. Anything an agent records you can enter, correct or delete yourself; anything you enter it can read. Run an engagement entirely by hand, entirely through the agent, or switch between the two mid-session.
Red Team Instructions
The Red Team Instructions are a single markdown document describing how to operate during testing: mindset, working discipline, ethics and scope. It is not a methodology; the check catalogue already owns “what to test”. This document is about conduct.
It matters because it reaches an agent in the MCP handshake, before the first tool call, rather than waiting to be asked for.
Resolution order
Resolution is most-specific-first:
- a per-engagement override, edited on that pentest’s PT Settings page
- an organization default, edited under Settings
- the built-in document, compiled into the binary
There is always an answer. A fresh install with nothing customised serves the built-in document to every agent that connects.
The built-in document
It opens by saying it is a reference, not a checklist, and that treating it as a complete list of things to test is a mistake. Then, in sections:
Mindset. Follow the application, not a list. Every response is information. Weird things deserve attention. Do not stop at confirming a vulnerability exists; work out what an attacker can actually do with it, because that is what determines severity.
Working discipline. Say what you are about to do before doing it, especially for anything that writes or modifies. Verify everything before writing it up. A finding that cannot be confirmed on demand is not a finding. Prove every claim, or use “probable” and “not confirmed during testing” and mean it.
Ethics and scope. Take the minimum access needed to demonstrate impact: a few real records with identifying fields visible proves a data exposure, a full dump proves nothing extra and creates a problem. Do not log in with discovered credentials unless told to. Leave third-party systems alone; document why you found them and move on. Keep regulatory and legal advice out of findings.
The rest is practical reference: recon, target assessment, JavaScript bundle analysis, API testing, error triggering, response headers, email security, takeover, exposed development artefacts, authentication flows, storage and file access, third-party services, CAPTCHA, management interfaces, then finding triage, severity calibration and how to write findings and replication steps.
Read it in full at Settings > Red Team Instructions, or ask a connected
agent for get_instructions.
Editing the document
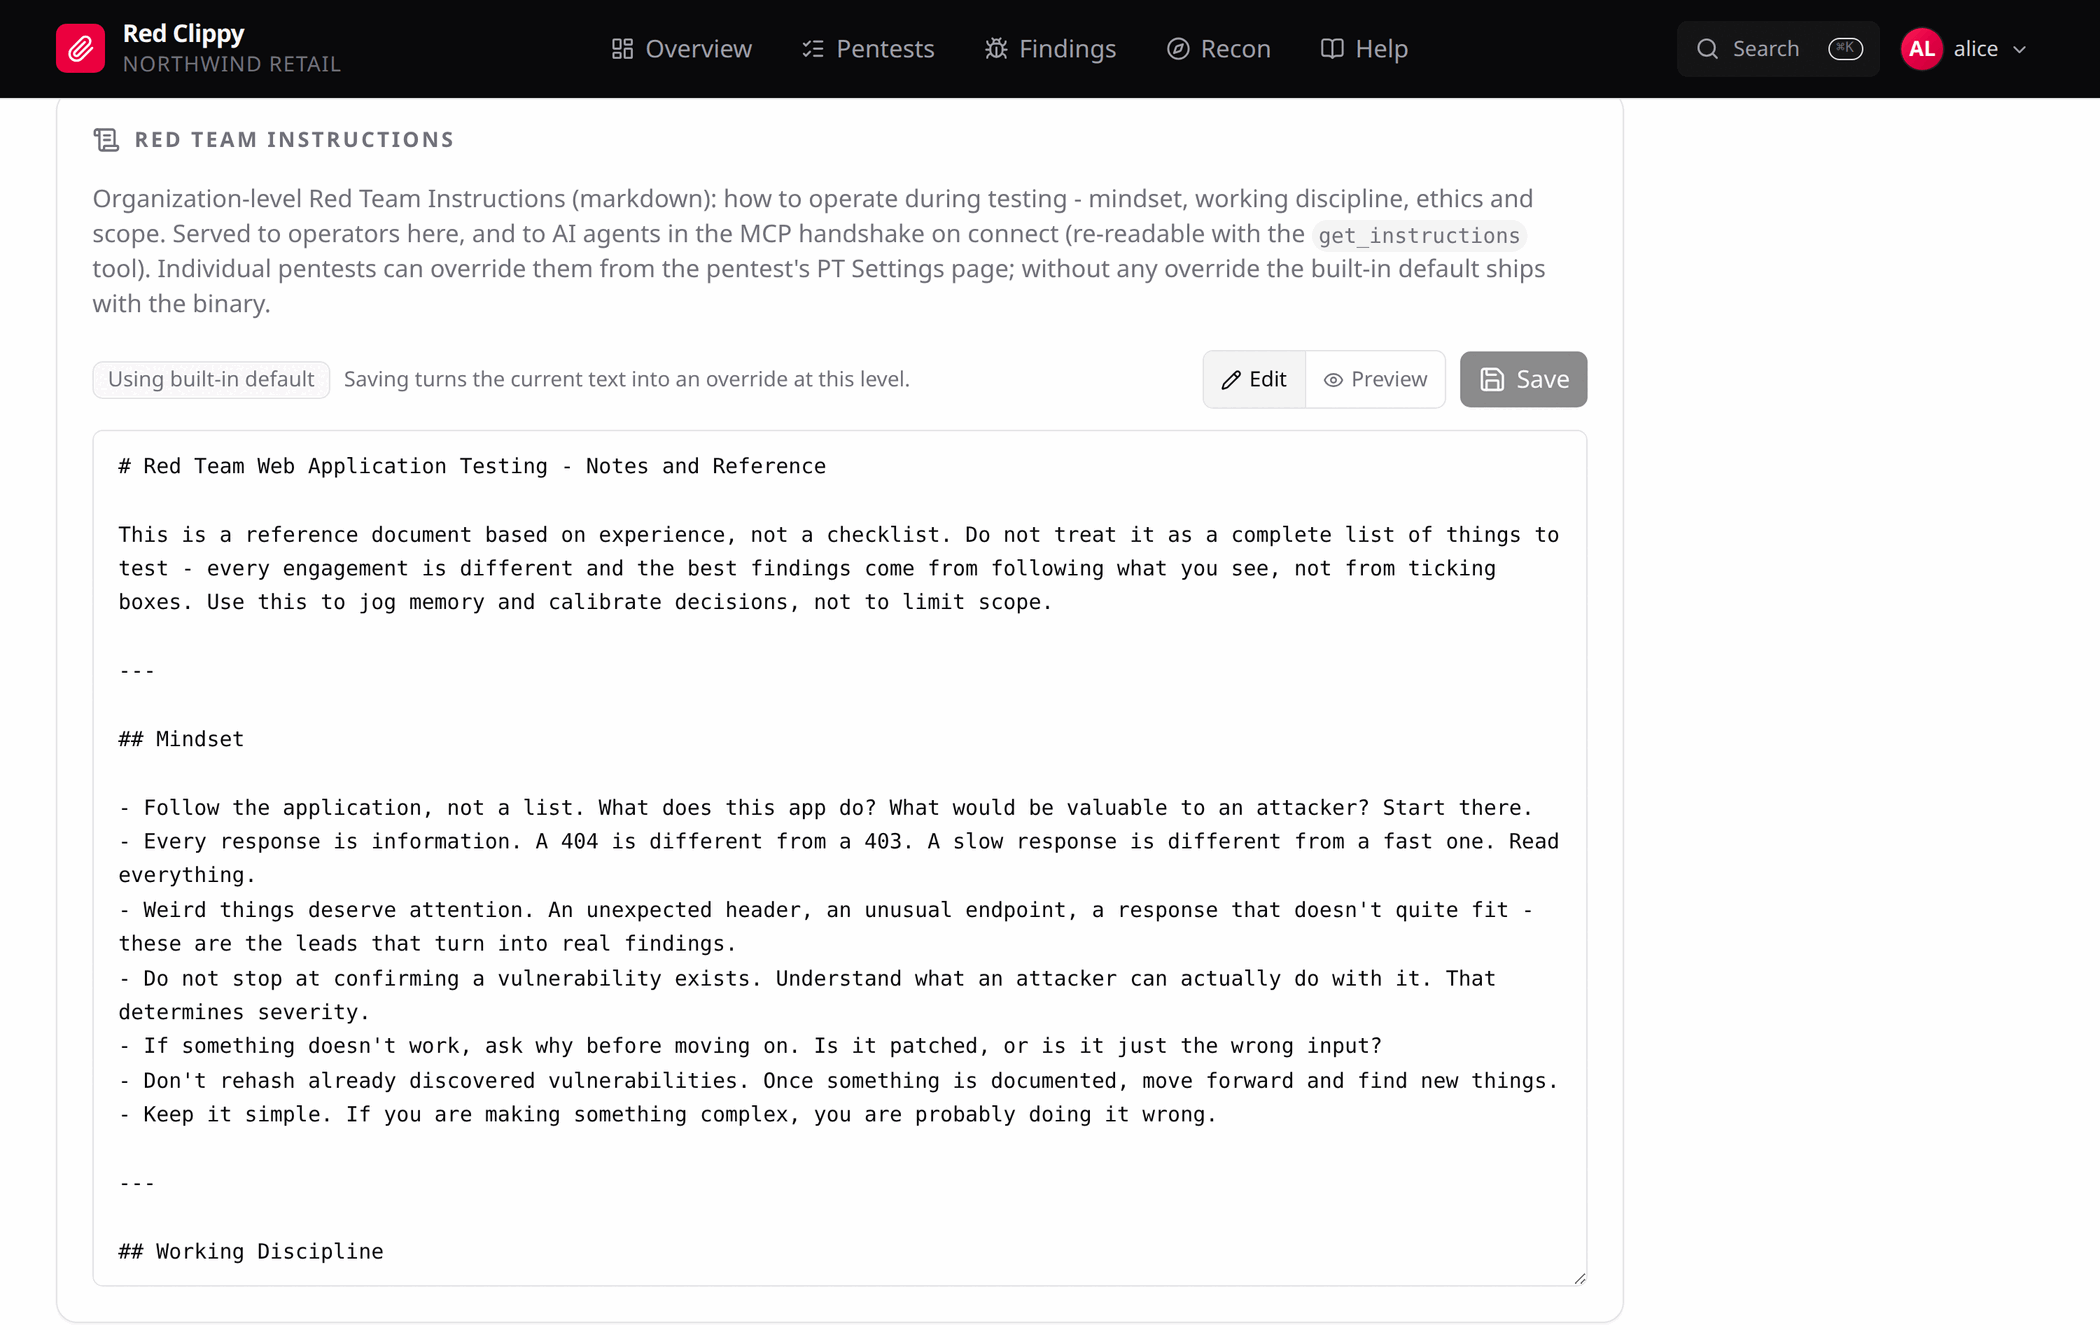
The editor is the same at both levels. A badge tells you where the text you are looking at came from:
| Badge | Meaning |
|---|---|
| Using built-in default | Nothing is customised at this level or above. |
| Using organization default | On a pentest page, when the organization has an override but this engagement does not. |
| Custom for this organization / Custom for this pentest | An override exists here, and Reset can remove it. |
Edit and Preview toggle between the markdown source and the rendered version. Save writes an override at the level you are editing, whatever text is in the box. Note what that means: saving on a pentest page while the built-in default is loaded copies the built-in text into a per-engagement override. If you only meant to look, do not press Save.
Ctrl+S saves. Reset deletes the override at this level and falls back to
the next one down, after a confirmation.
When to override
At organization level, for house rules that apply to every client: your reporting conventions, your evidence standards, the things your team has learned the hard way.
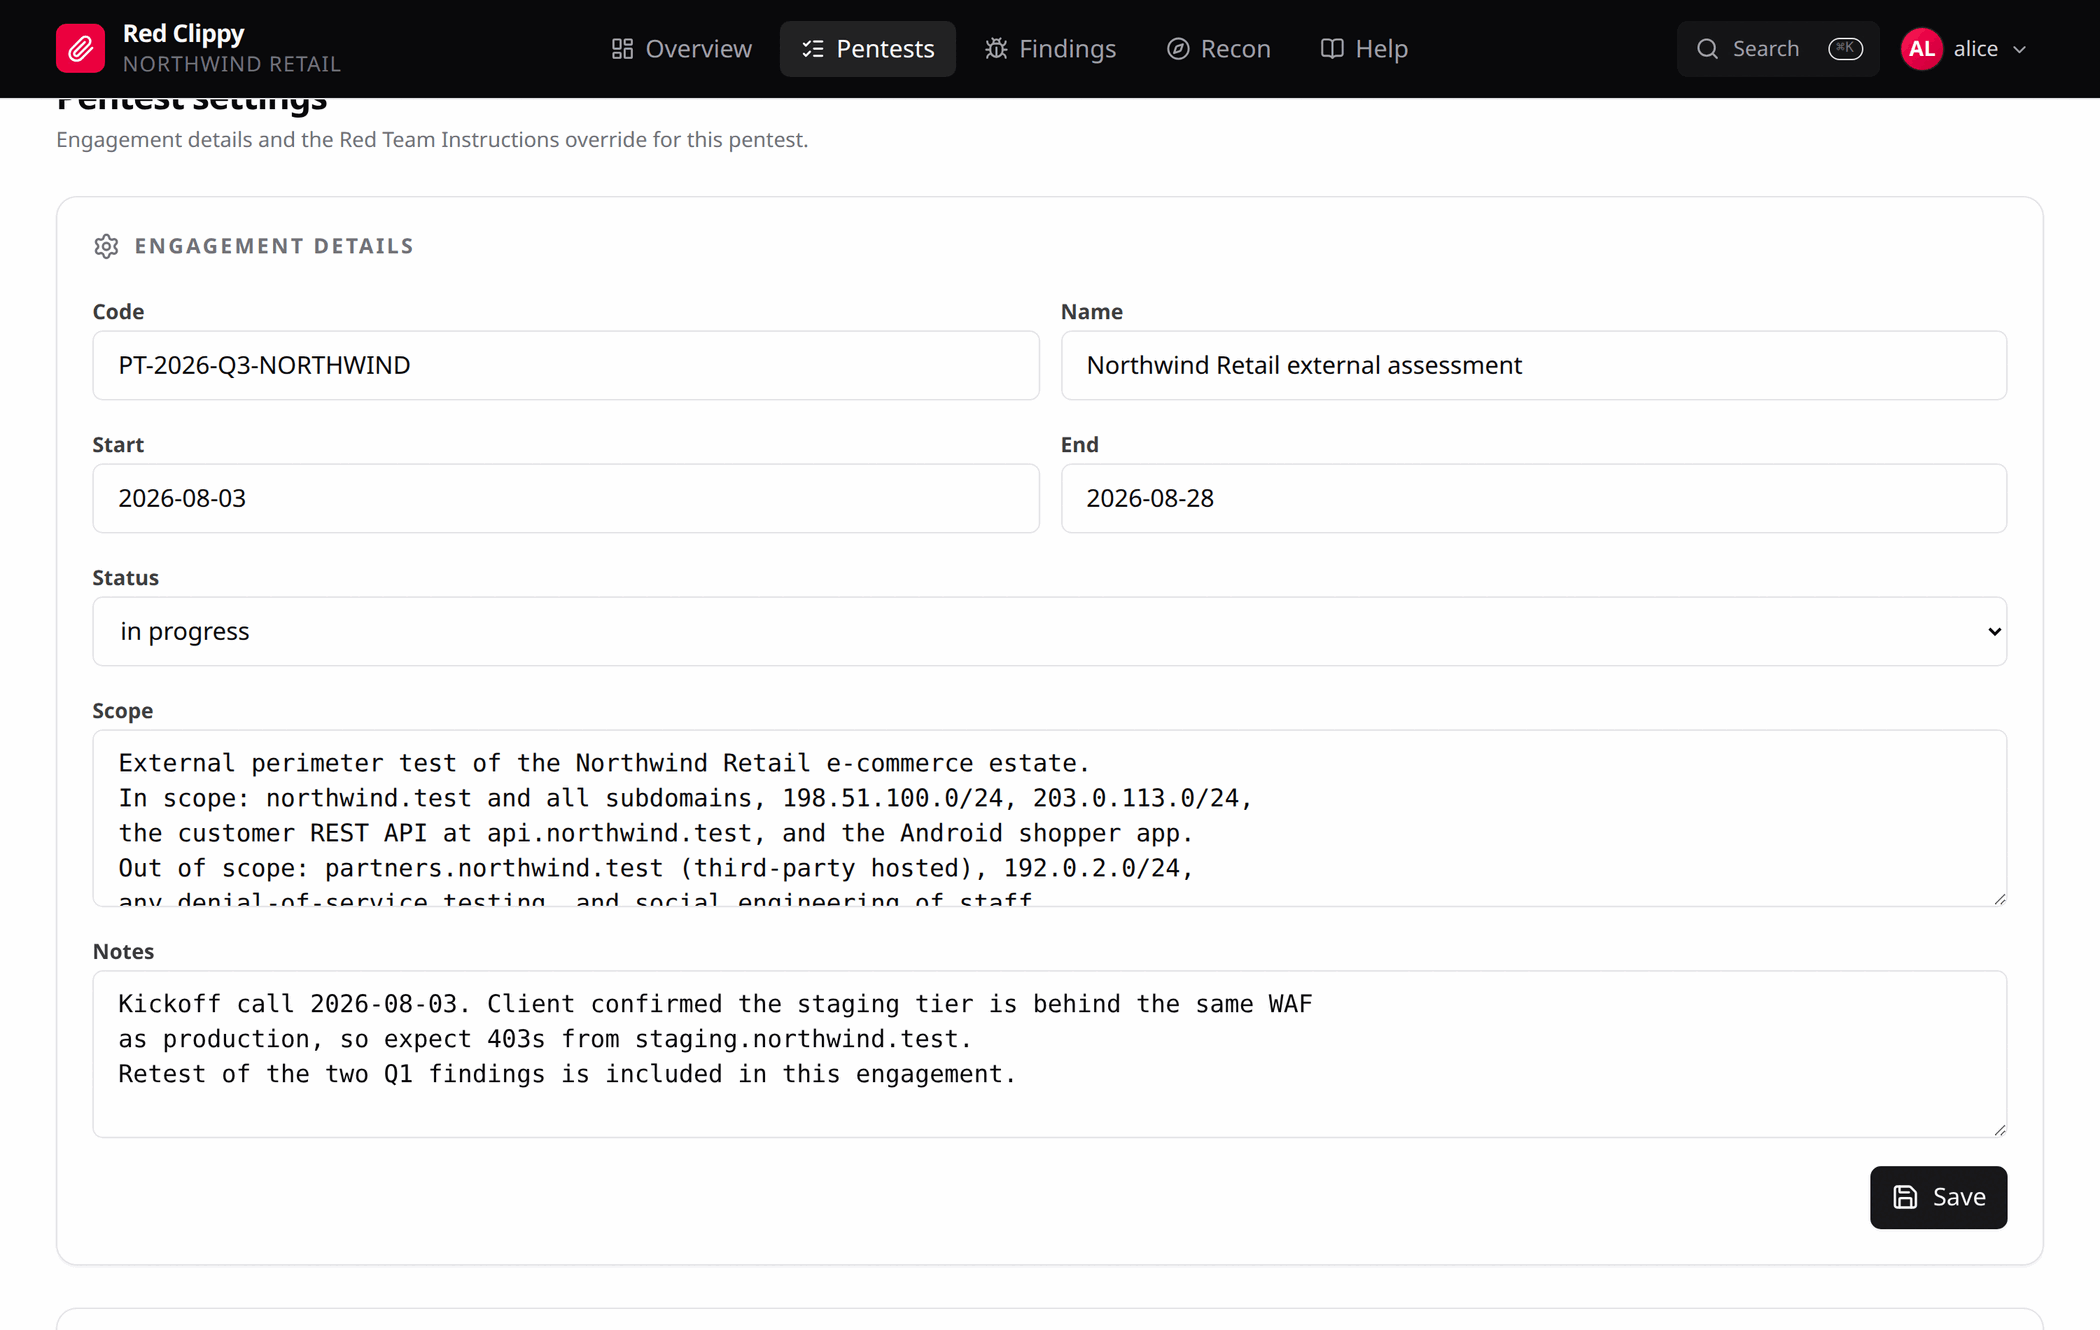
At engagement level, for this client’s rules of engagement: a test window, a system that must not be touched even though it resolves inside an in-scope range, a customer who wants no automated scanning at all, a requirement to notify before anything intrusive.
Keep the machine-enforceable parts of scope in the actual scope markings, on assets and IP ranges. The instructions are for the parts a rule cannot express.
Over MCP
Three tools, all of which take a scope argument of org or pentest:
| Tool | What it does |
|---|---|
get_instructions | Returns the resolved document and which level it came from. |
set_instructions | Writes an override at the given level. |
reset_instructions | Deletes the override at the given level. |
An agent gets the document automatically on connect. get_instructions is for
re-reading it mid-session, which is worth asking for when a long session has
pushed the handshake out of context.
set_instructions exists so an agent can help you write the document, not so
it can rewrite its own rules unprompted. The handshake text tells it to change
the document only with your agreement, which is a norm rather than a control.
If that matters to you, watch the Settings page: an override that appeared
without you asking for it is visible there.
Getting around
The panel is a single-page app served by the same binary that serves the API. Everything in it is reached from the top bar.
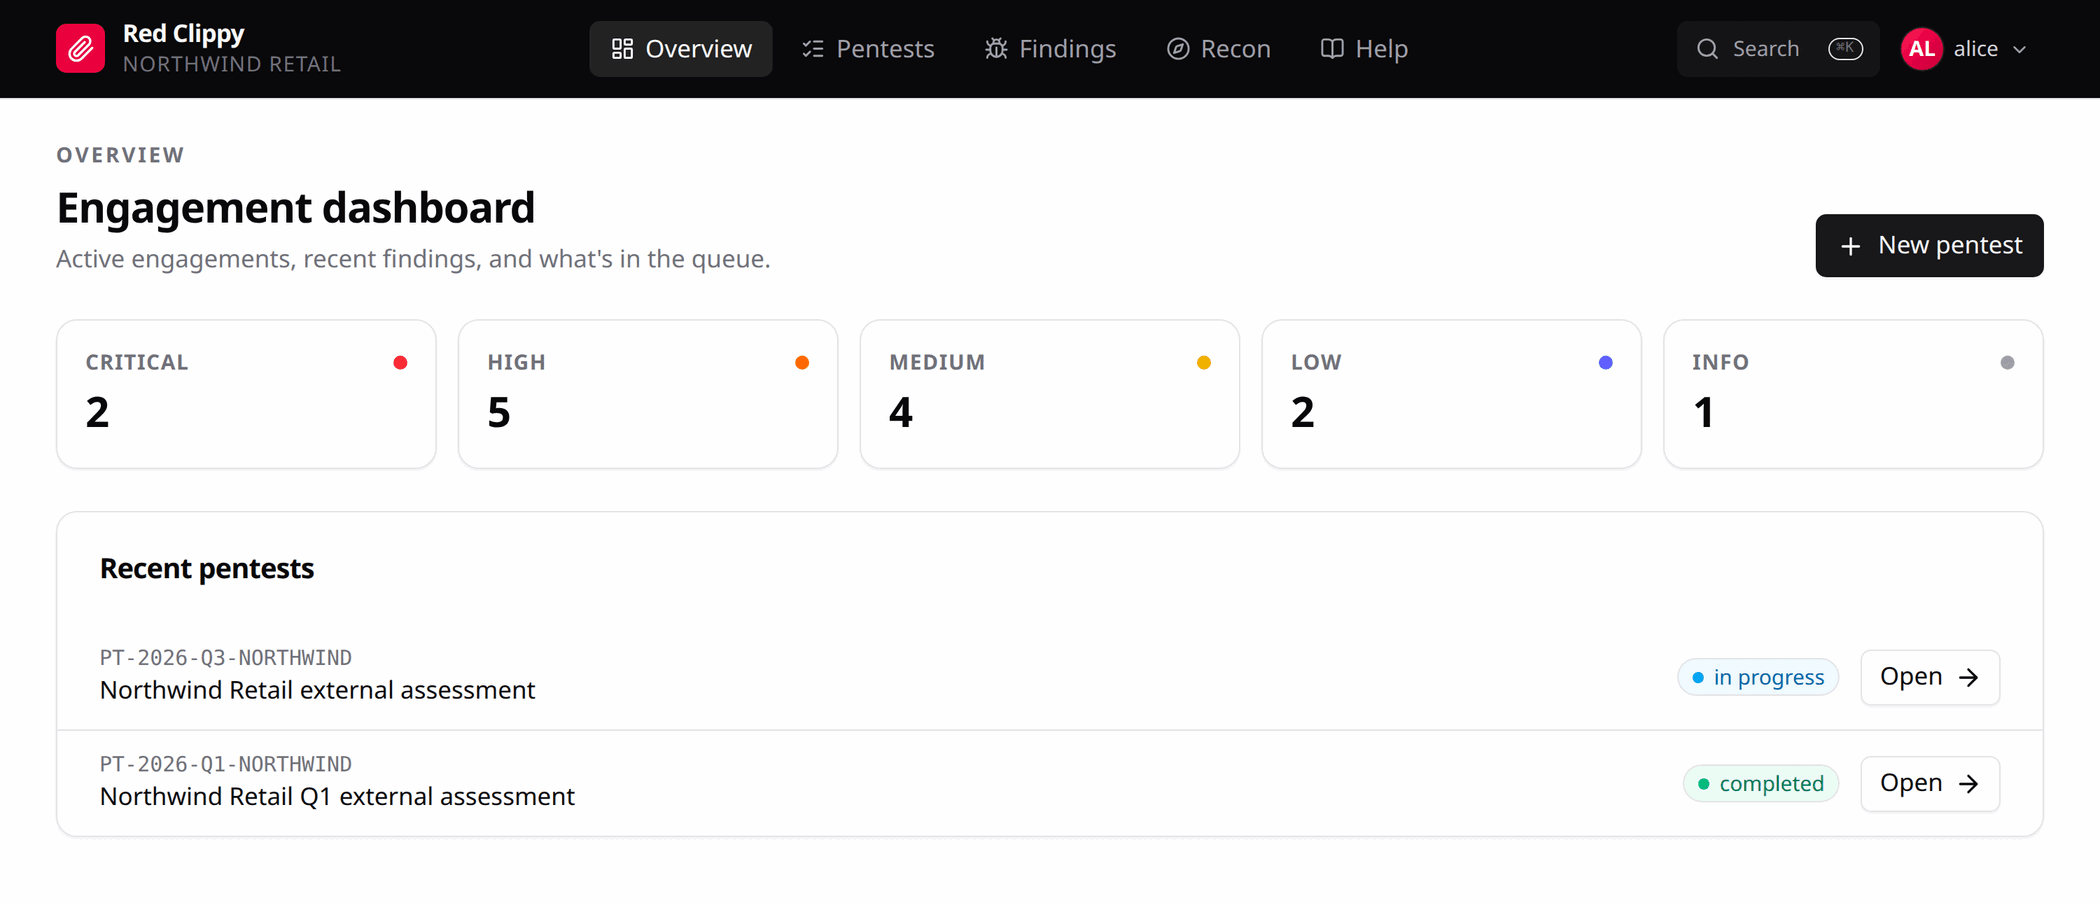
The top bar
Five links, left to right after the logo:
| Link | What it shows |
|---|---|
| Overview | The dashboard above: severity counts across the organization and your recent engagements. |
| Pentests | Every engagement in this organization, searchable and filterable by status. |
| Findings | Every finding across every engagement, in one list. |
| Recon | Every asset across every engagement, in one list. |
| Help | The in-app tutorial for connecting an agent. |
Under the logo is the display name of the organization you are currently working in. If it says the wrong client, you are in the wrong tenant. Switch from the avatar menu.
On the right:
- a Search button that opens the command palette
- the avatar menu, holding Organizations, Settings, the theme picker and Sign out
On a narrow screen the five links collapse into a drawer behind the menu button.
The dashboard
The severity tiles count findings across your 25 most recent engagements, not just the active one. A total that looks too high usually means an old engagement is still being counted.
The command palette
Press Ctrl+K (or Cmd+K on macOS) anywhere in the panel.
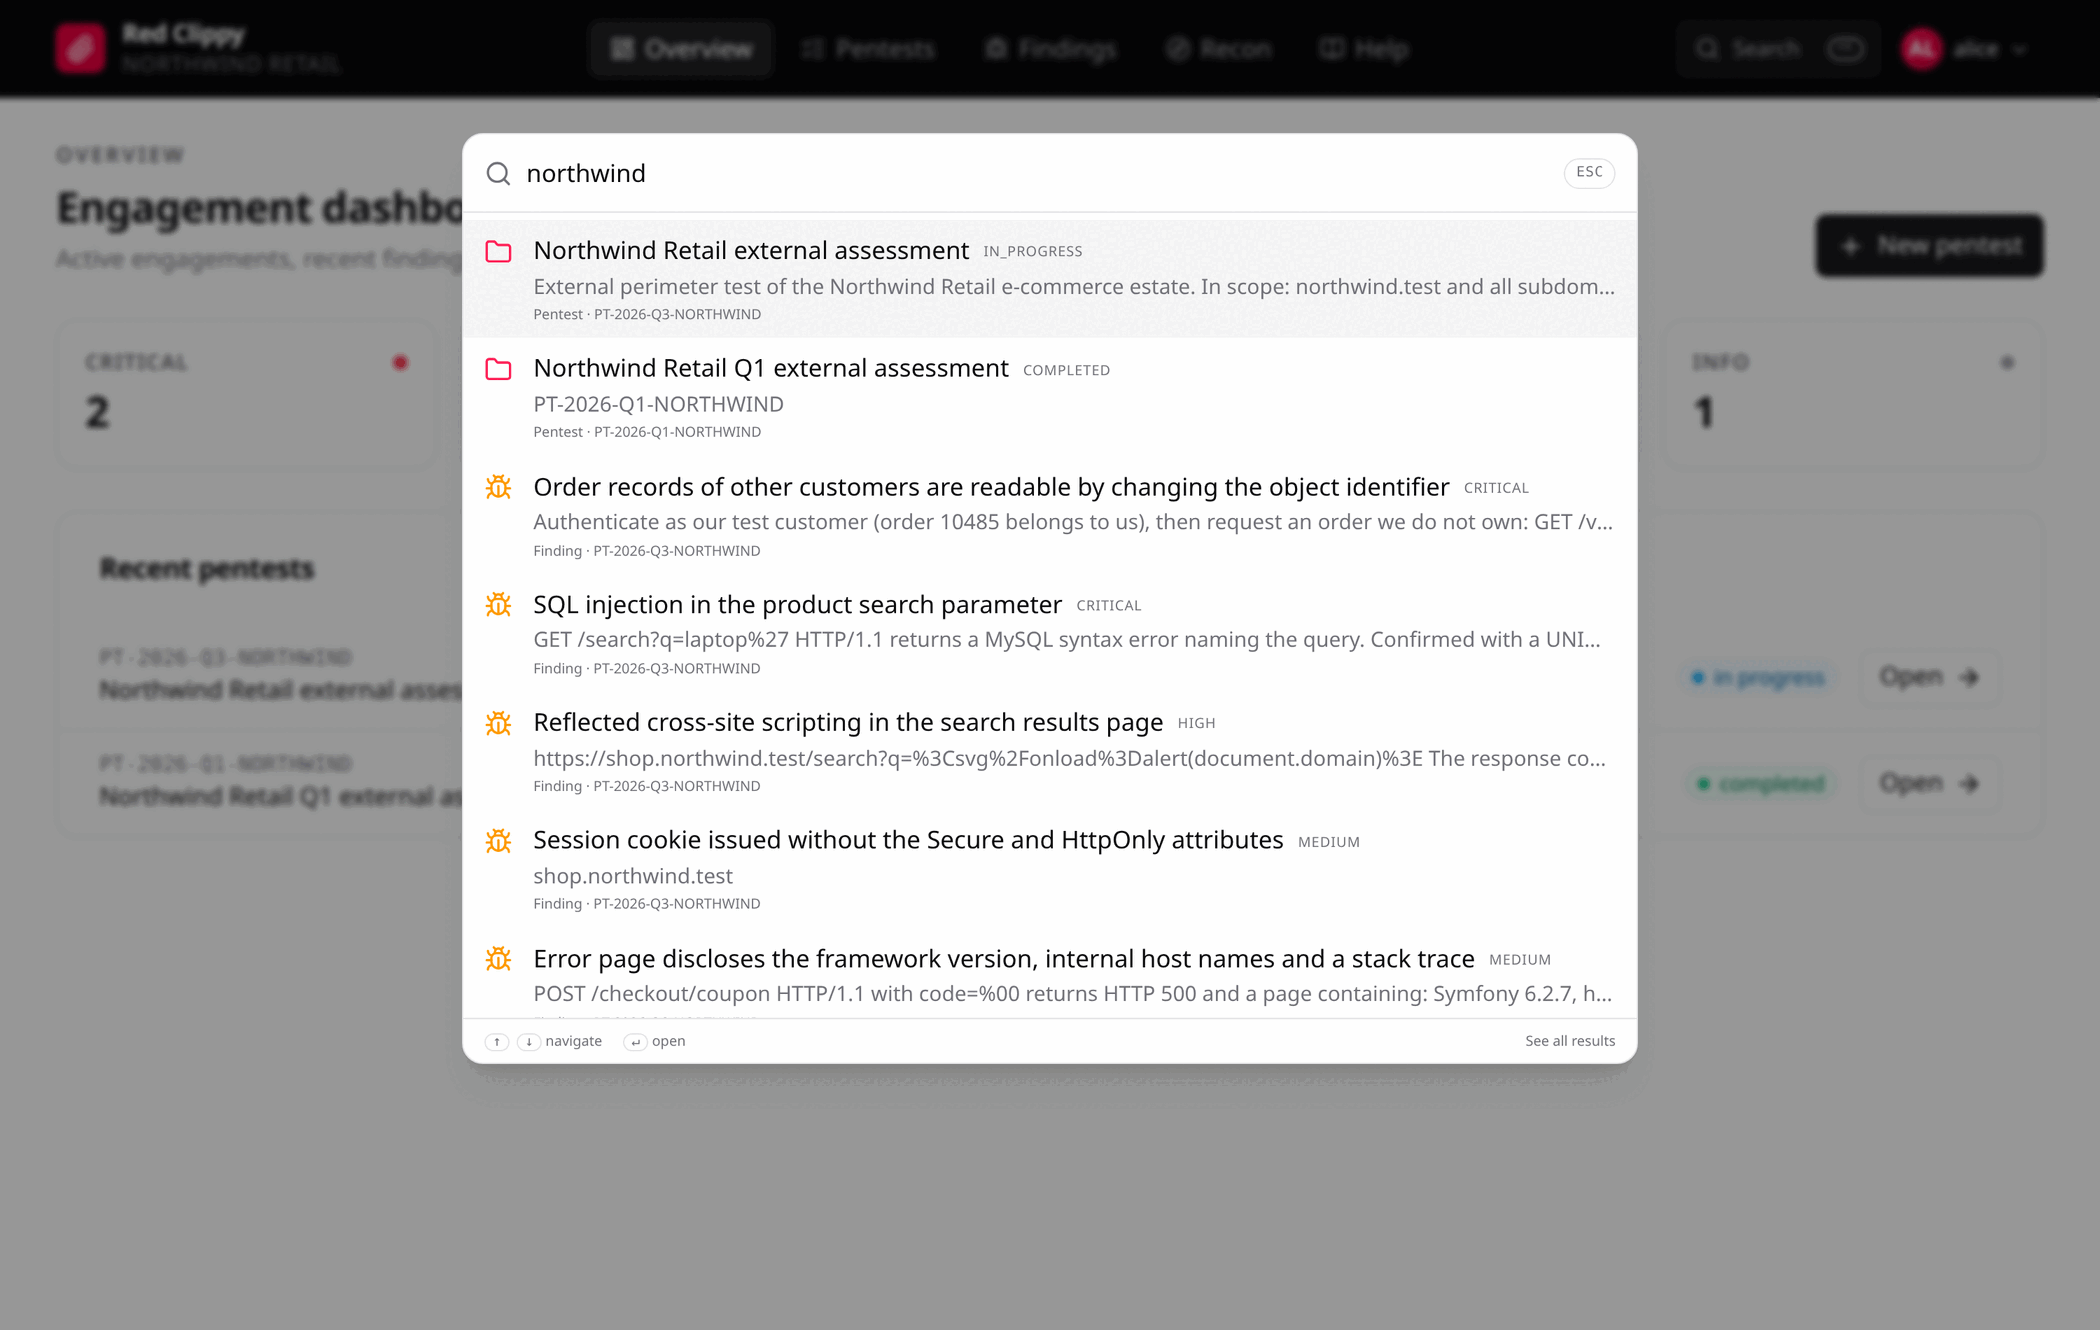
It searches across pentests, findings, assets, observations, phases and
attachments in the current organization at once. Each row says which kind of
record it is and which engagement it belongs to. Arrow keys move, Enter
opens, Escape closes.
Paste a hostname, an IP, a partial path, a username or a CVE identifier. When there are more matches than the palette can show, See all results opens the full search page, described in Searching across engagements.
Inside an engagement
Opening a pentest replaces the page with the engagement shell: a breadcrumb and title at the top, a row of tabs under it, and three buttons on the right.
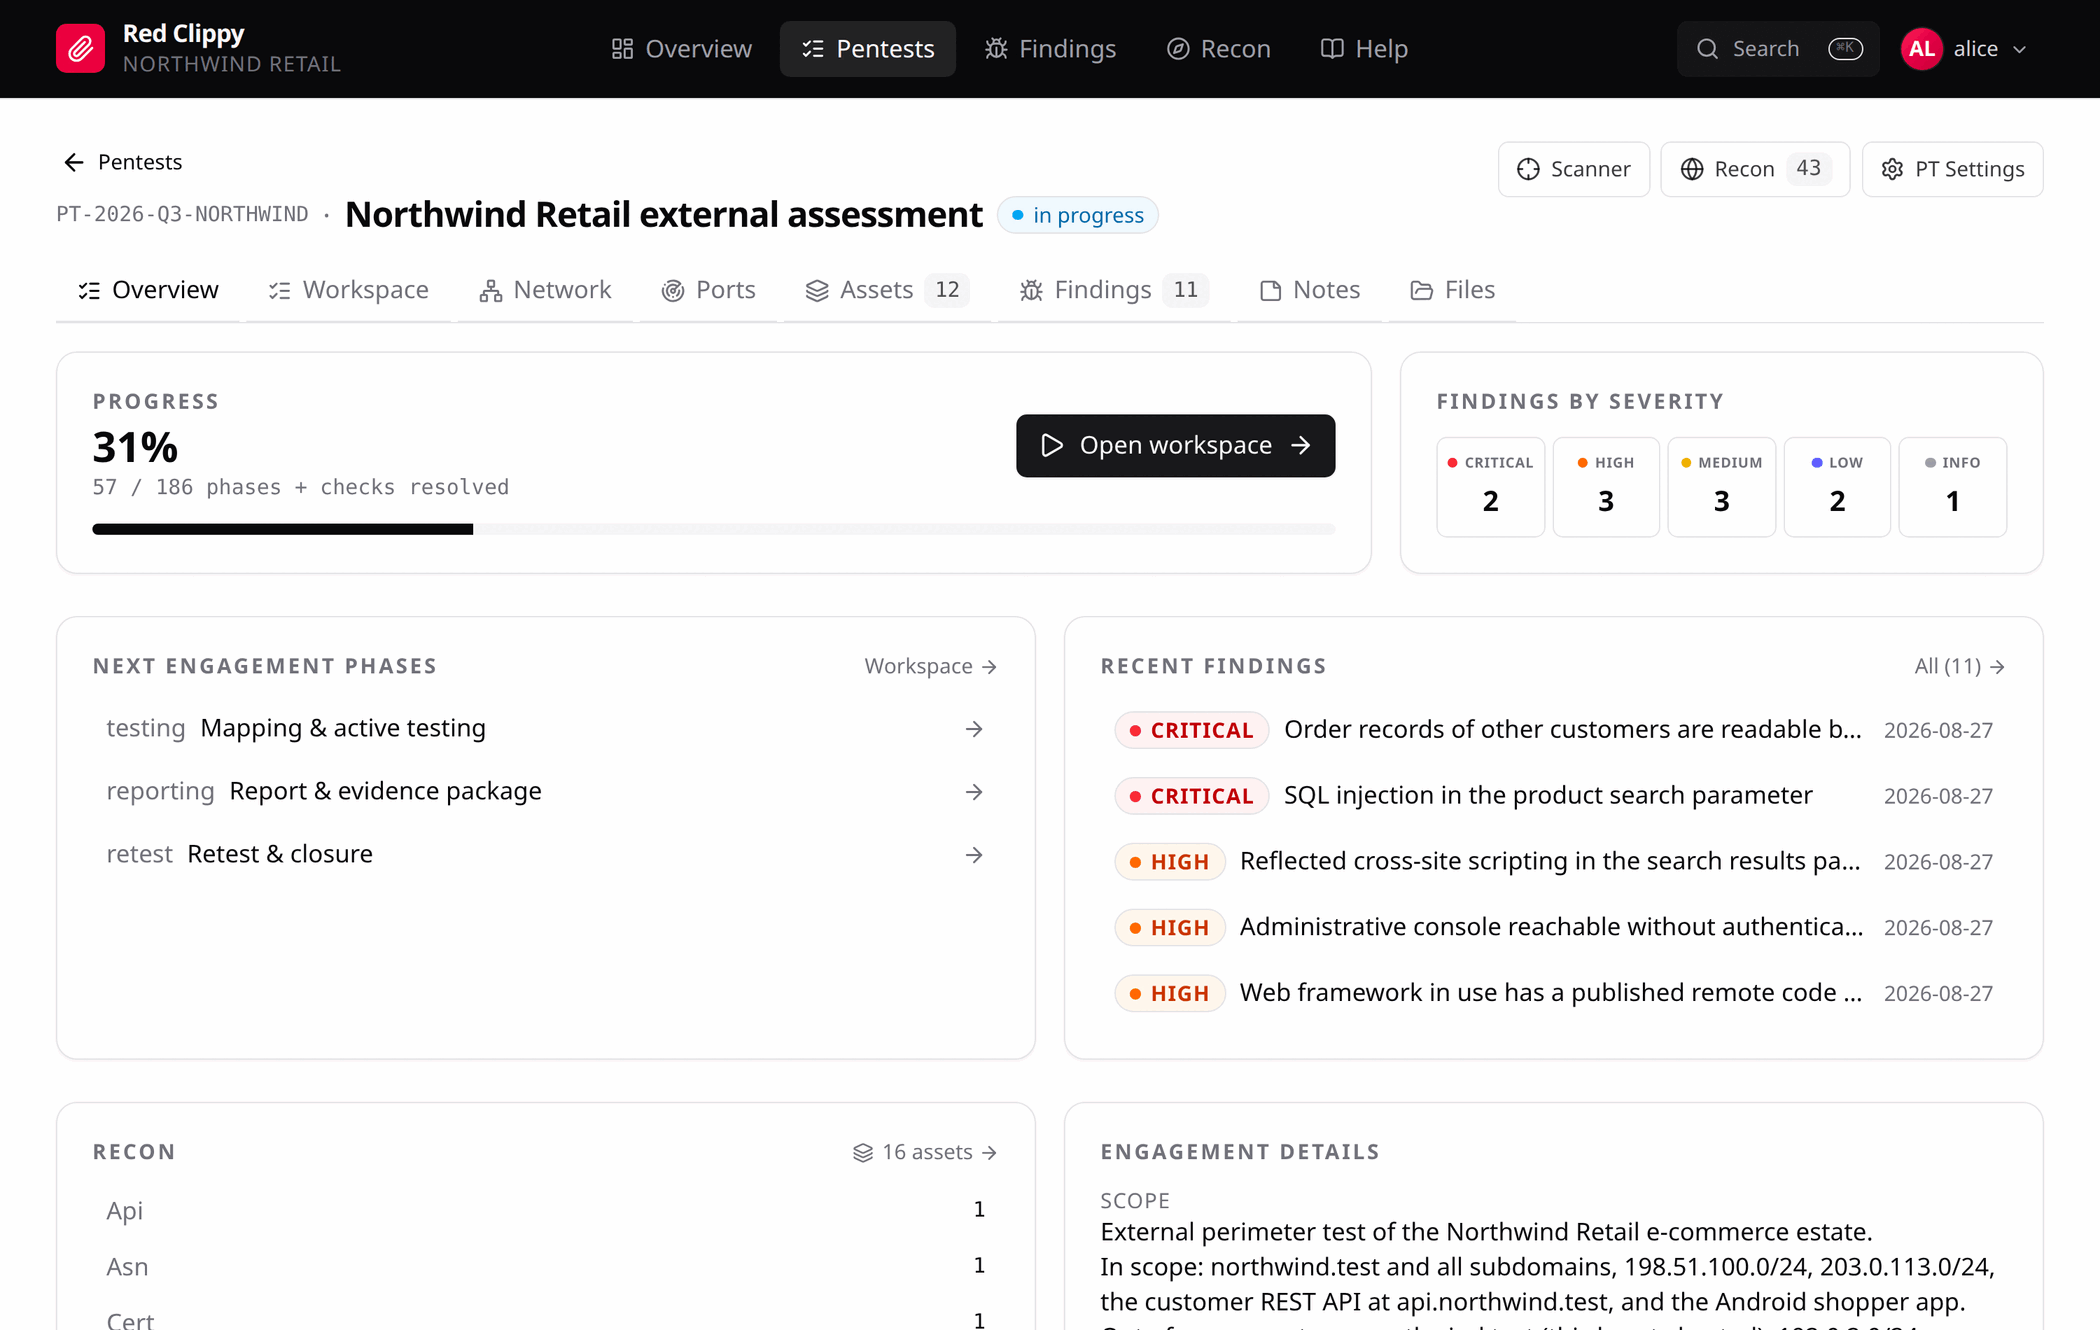
The tabs are:
| Tab | Page |
|---|---|
| Overview | Progress, severity breakdown, next phases, recent findings, engagement details. |
| Workspace | Engagement phases, and per-asset methodology when an asset is focused. |
| Network | Declared CIDR ranges and discovered IP clusters. |
| Ports | Every open port found in this engagement, grouped or tabulated. |
| Assets | The scope list: in scope, flagged, out of scope. |
| Findings | The findings for this engagement. |
| Notes | A full-page scratchpad. |
| Files | The engagement’s file area. |
The three buttons on the right stay put on every tab:
- Scanner opens the built-in scan engine
- Recon opens a side drawer listing this engagement’s observations, with a quick add form
- PT Settings opens engagement details and the Red Team Instructions override
Counts next to a tab are live. Assets counts in-scope, reachable assets only, since that is the remaining workload rather than the total inventory.
Theme
The theme picker in the avatar menu has three settings: System, Light and Dark. System follows the operating system and keeps following it. The other two pin the panel regardless of what the OS reports, which is useful when you are capturing screenshots for a report.
Pentests
A pentest is one round of testing against one client. That might be a quarterly external assessment, an annual full-scope review, or a retest after the client fixes what you reported last time. Client work is rarely a one-off, so each round gets its own pentest record rather than being added to the last one.
Every asset, observation, finding, check and file you record belongs to exactly one pentest. That keeps each round’s results self-contained, while the organization-wide Findings and Recon pages read across all of them: what you reported last time, whether a host has been tested before, what is still open.
The list
Pentests in the top bar lists every engagement in the current organization, newest first.
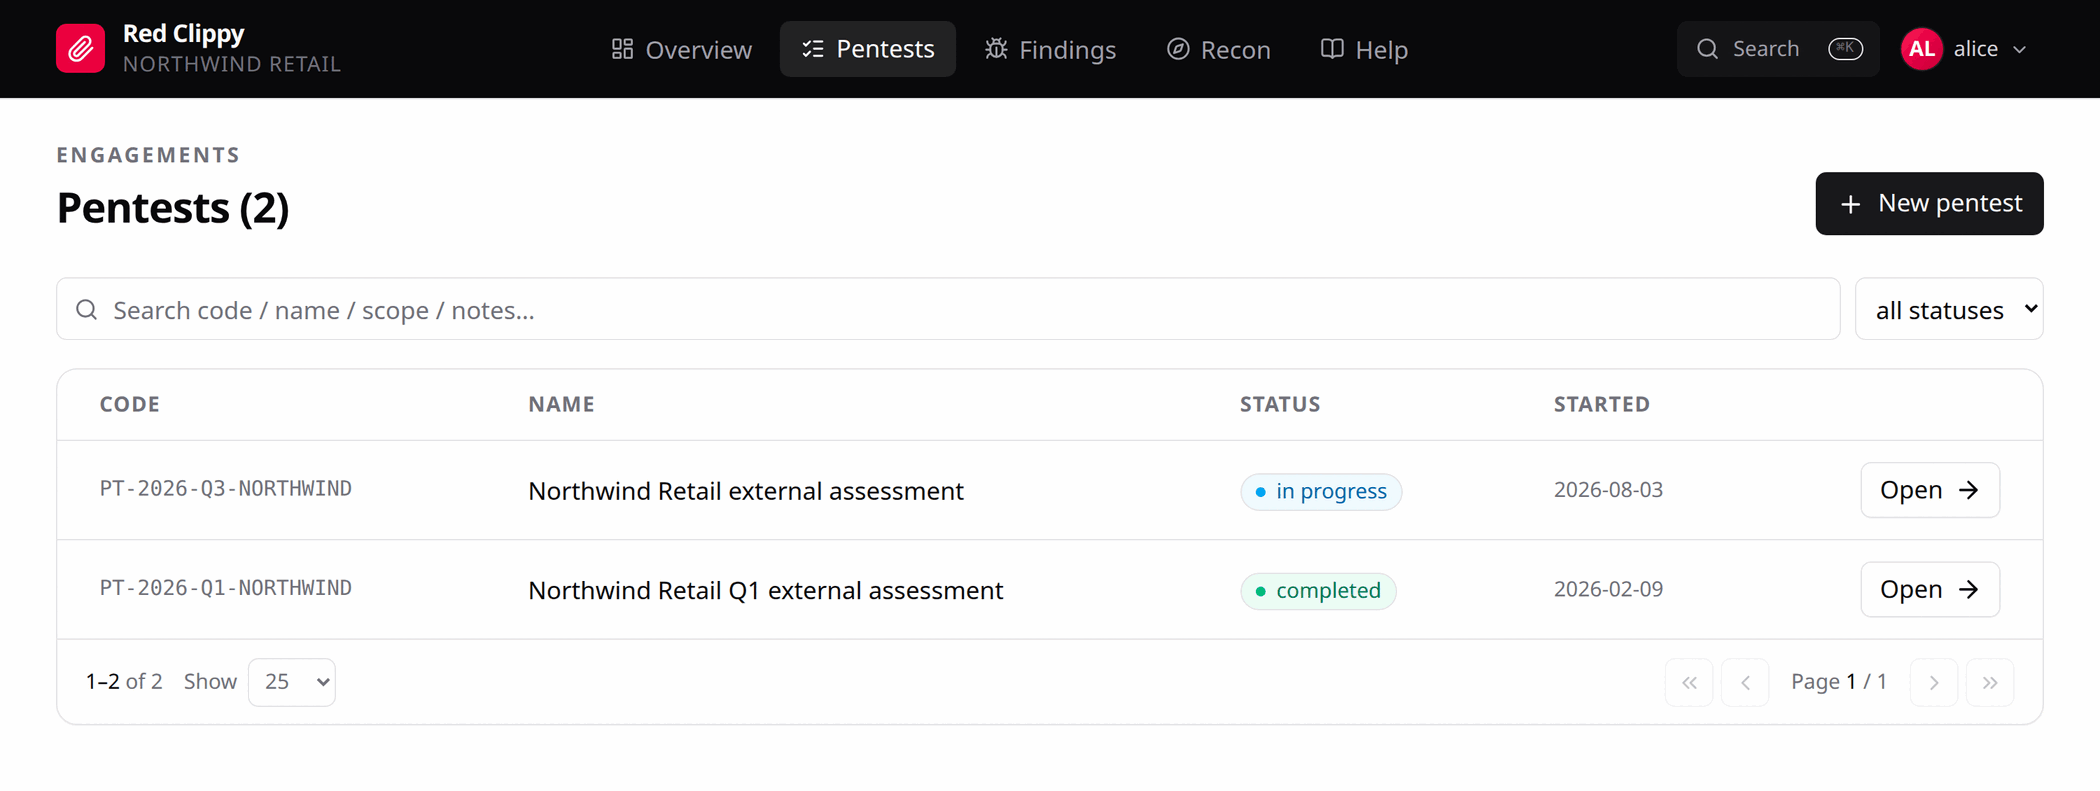
The search box matches on code, name, scope text and notes. The dropdown next to it filters by status. Both live in the URL, so a link to a filtered view sends someone else to the same filtered view, and the browser back button does what you expect.
Creating a pentest
New pentest opens a form with a single field.
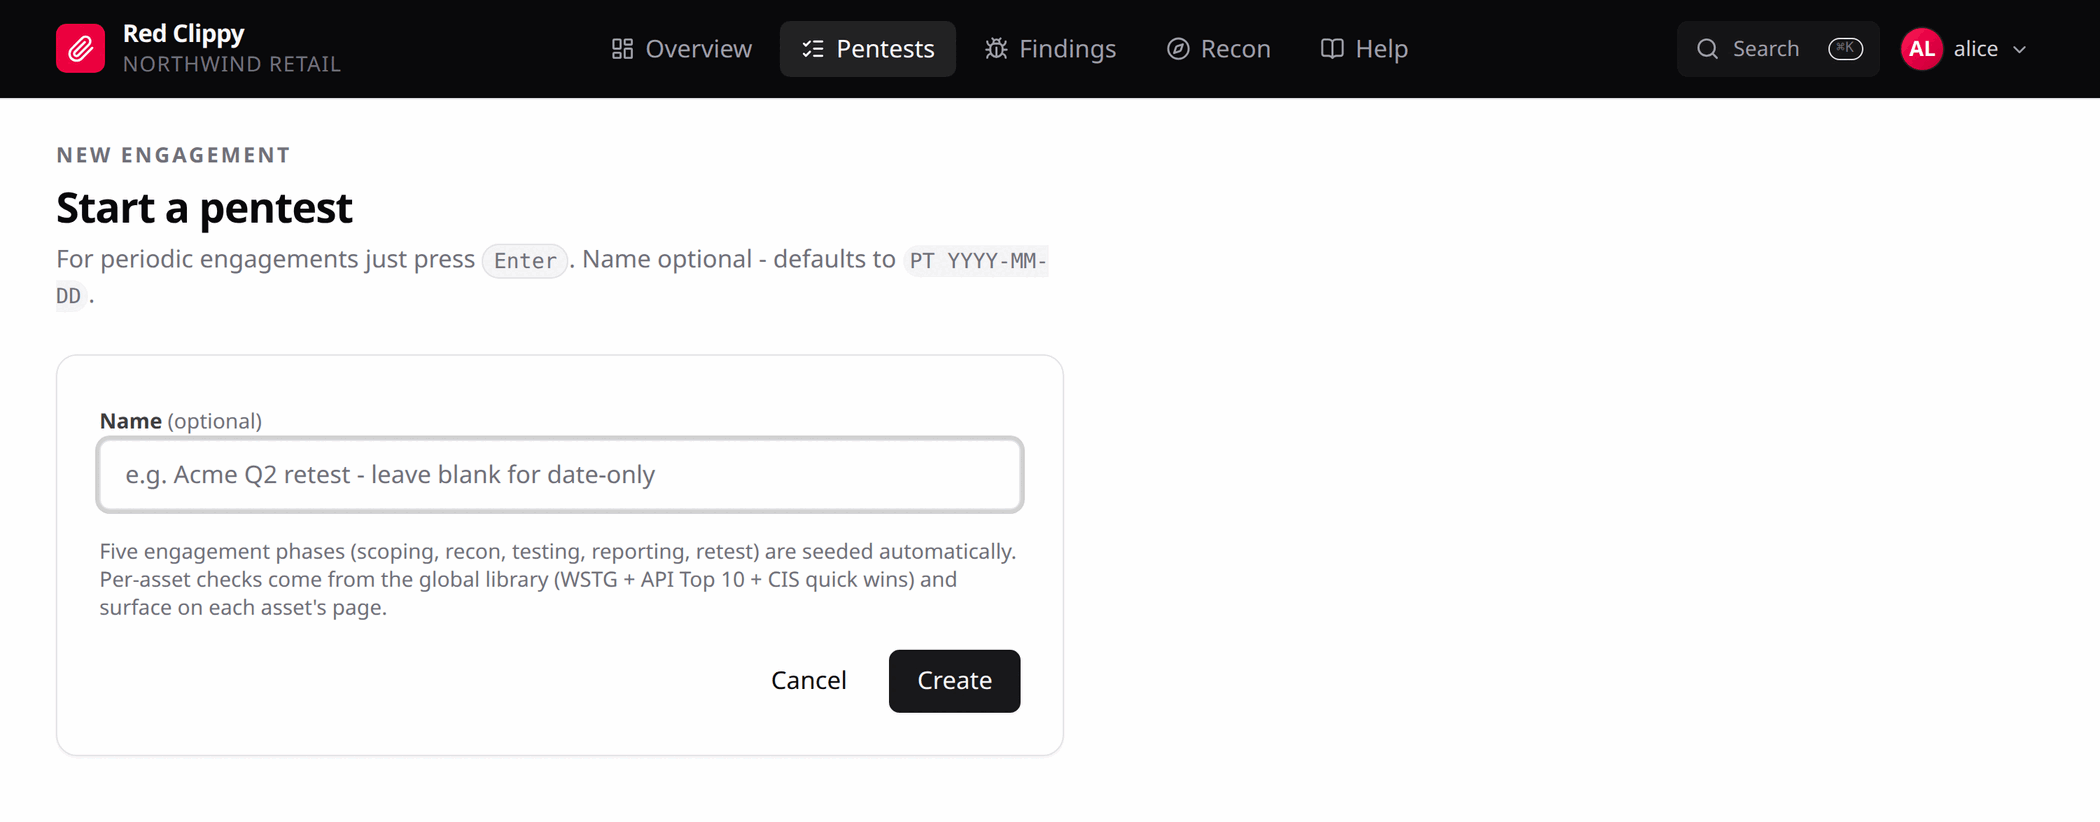
The name is optional. Leave it blank and press Enter for a pentest named
after today’s date, which suits a recurring internal test. Type a name and the
code is derived from it: “XYZ Q3 retest” becomes something like
PT-2026-08-27-xyz-q3-retest.
Creating the pentest seeds the five engagement phases and wires up the check catalogue. The remaining details (code, scope, dates, status) are edited afterwards on the PT Settings page.
The engagement overview
Opening a pentest lands on Overview. This is the “where are we” page.
Findings by severity counts this engagement only, unlike the tiles on the main dashboard.
Next engagement phases lists what is still unresolved. Clicking one jumps into the workspace with that phase selected.
Engagement details shows the scope, dates and notes as entered on PT Settings.
PT Settings
The PT Settings button sits top right on every tab inside an engagement.
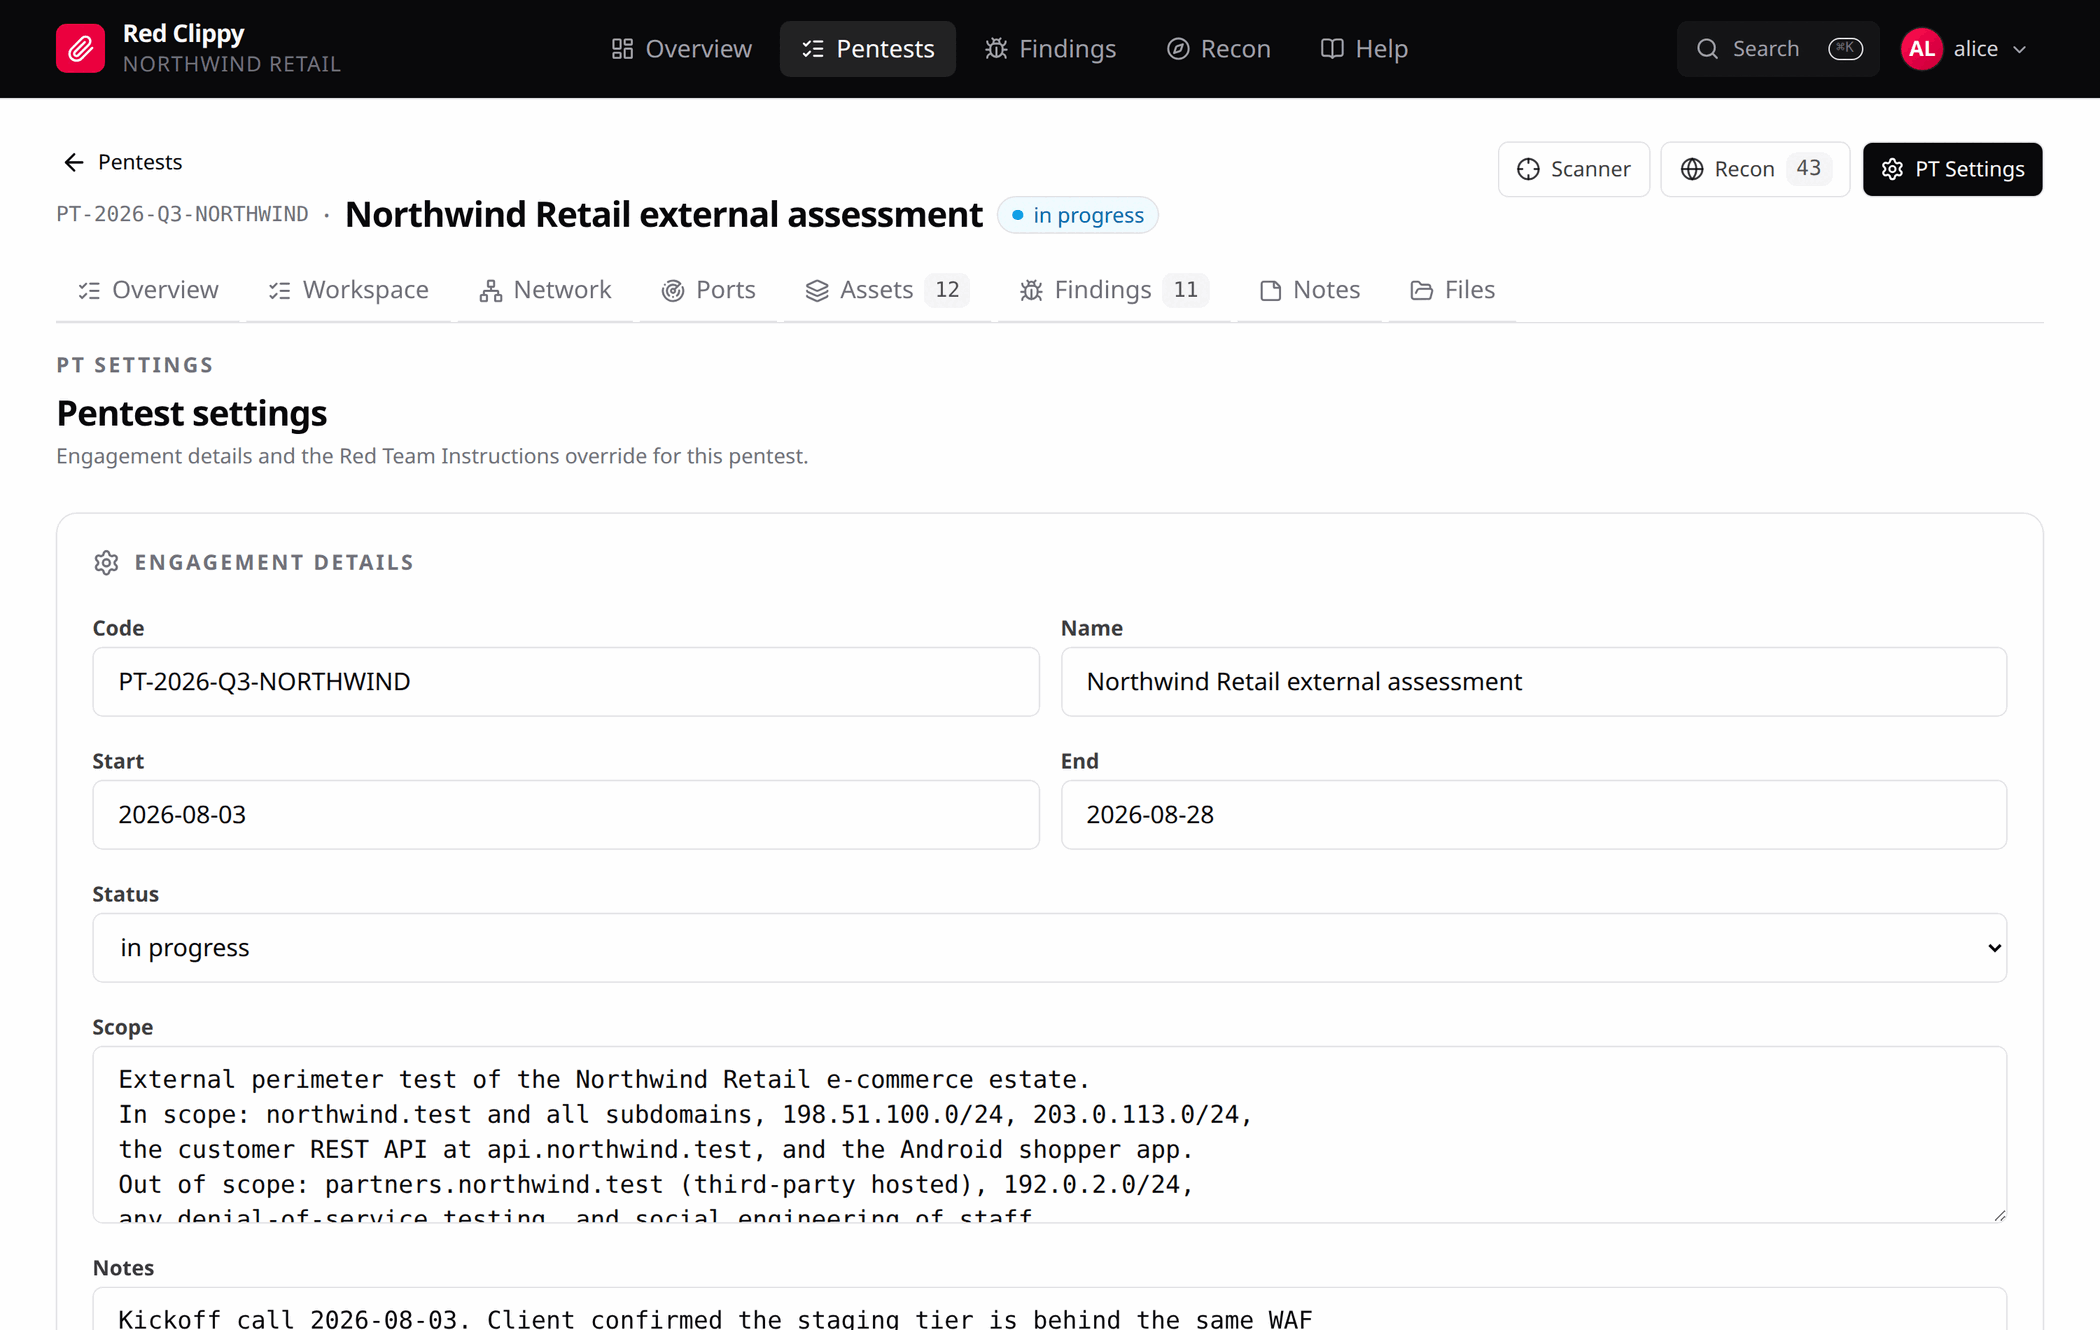
The top card is the engagement record itself:
| Field | Notes |
|---|---|
| Code | Shown for reference. The code is fixed at creation because the on-disk storage path is derived from it, so the server ignores edits to this field. |
| Name | Free text. Required. |
| Start / End | YYYY-MM-DD. |
| Status | planned, in progress, completed, archived. |
| Scope | Free text. Shown at the top of the Network page and under Engagement details. |
| Notes | Anything else about the engagement. Shared with the Notes tab. |
Put the real rules of engagement in Scope: what is in, what is out, the test window, and who to call. Nothing enforces the text, but it is what a human reads before testing and what an agent sees when it reads the engagement. Machine-enforced scope is separate, set with the in-scope and out-of-scope markings on assets and IP ranges.
Below that is the Red Team Instructions override for this engagement, covered in Red Team Instructions.
Closing an engagement
Set the status to completed when the report goes out, and archived when you
are done with it entirely. Archived pentests stay in the list and stay
searchable; the status is a marker, not a filter that hides them.
A pentest cannot be deleted, from the panel or the API or MCP. Assets, observations and findings can each be removed individually, but the engagement record is permanent once created, so a mis-typed code or a throwaway test engagement stays in the list. Archive it.
The one thing that removes a pentest is deleting the organization it belongs to, which takes every other engagement with it. See Organizations and members.
Scope and assets
The Assets tab is the scope list: everything you are testing, everything you have set aside, and everything the customer told you to leave alone.
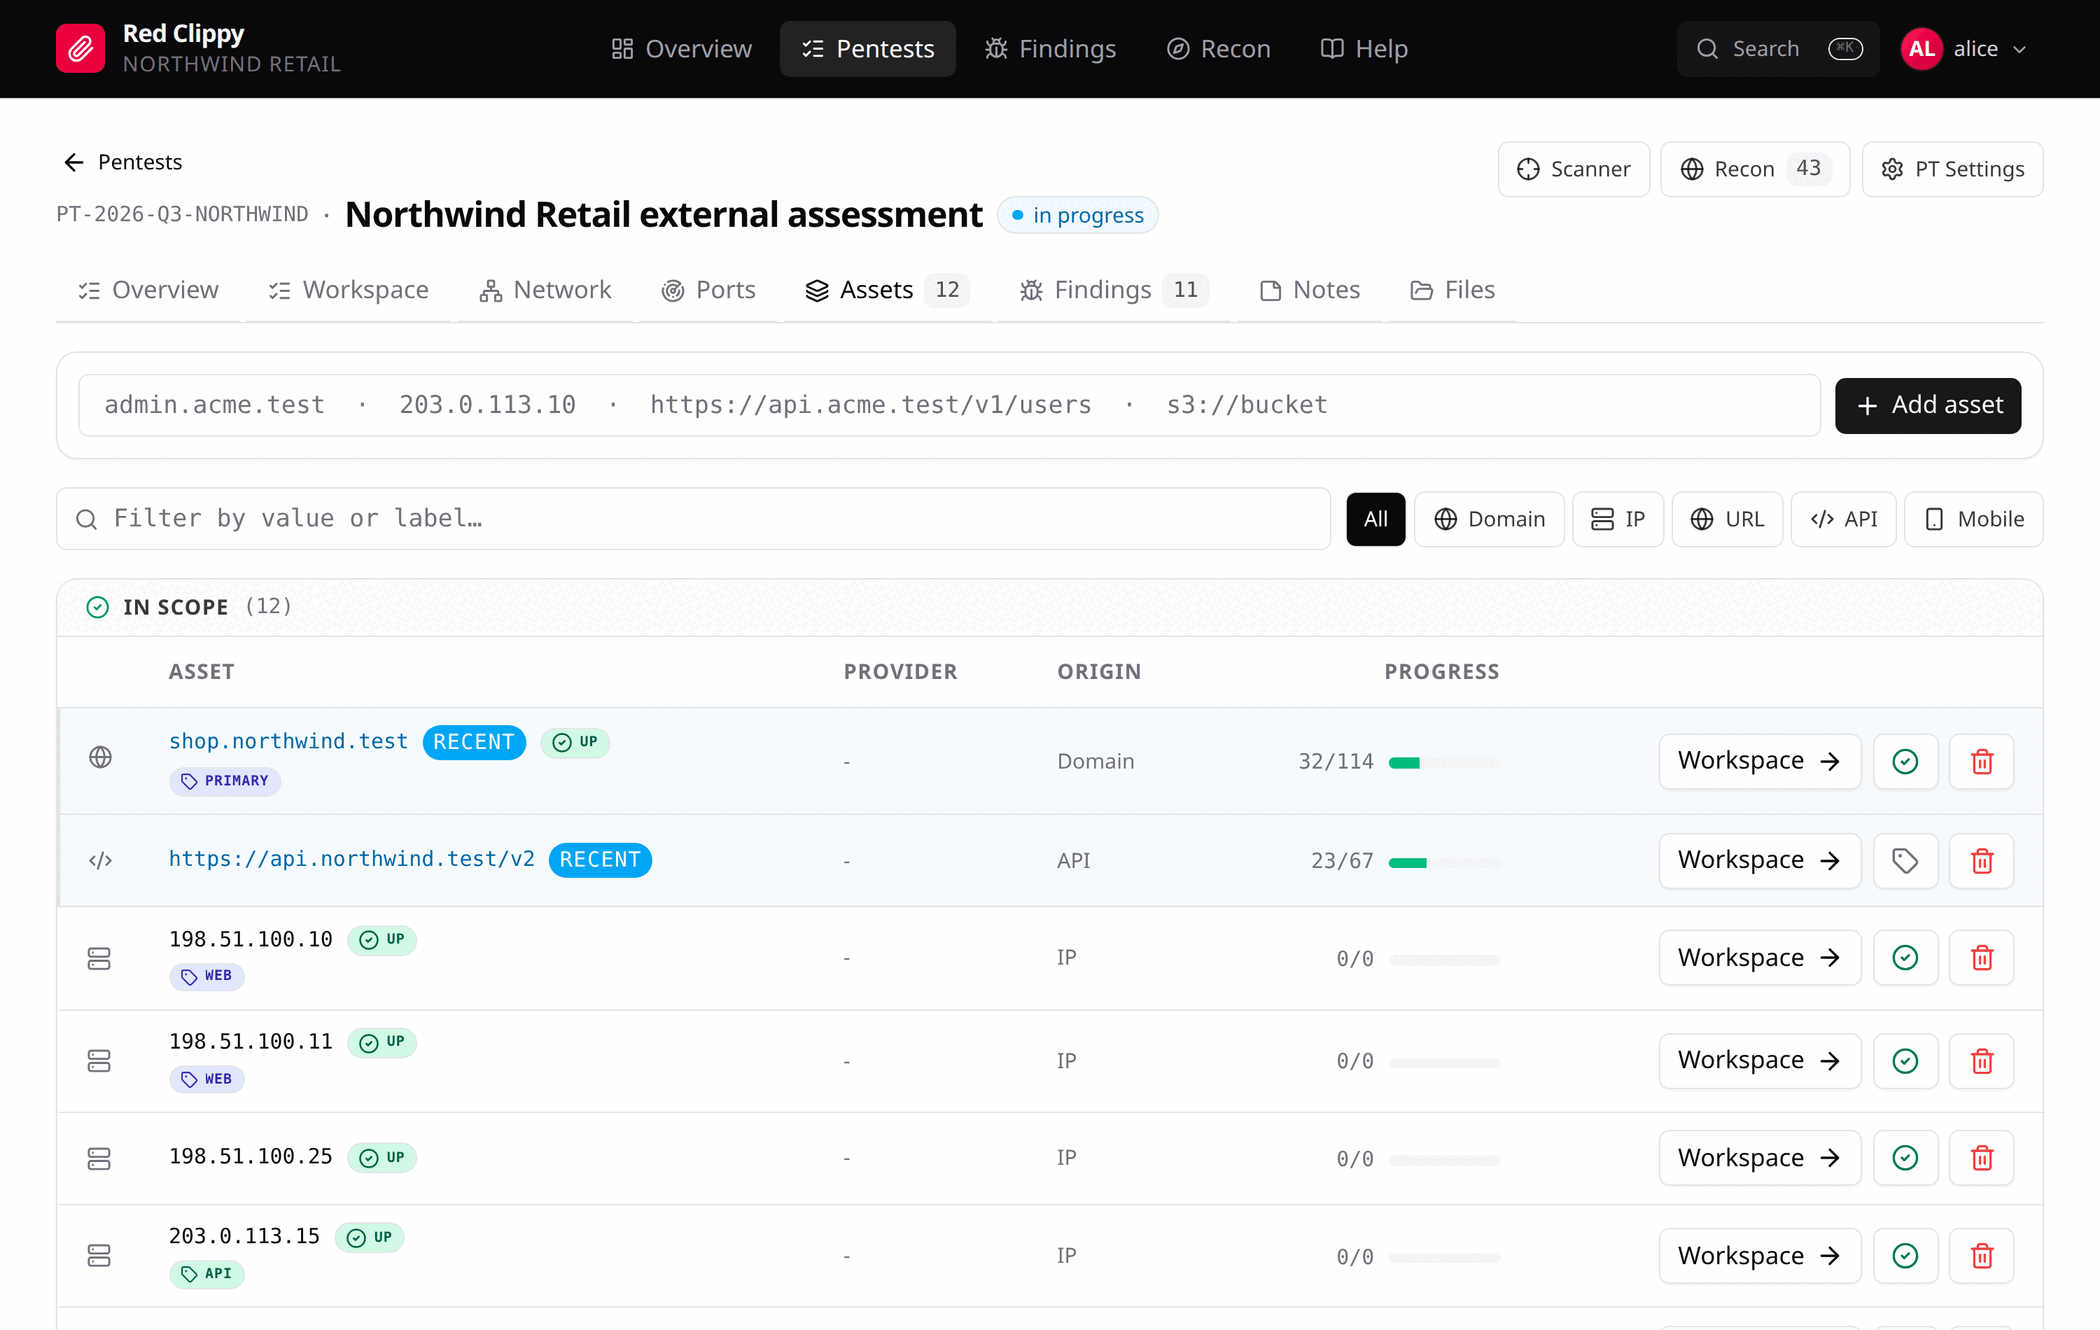
Adding assets
The box at the top takes one value. The kind is inferred from its shape, so
shop.example.com becomes a domain, 198.51.100.11 an IP,
https://shop.example.com/checkout a URL. If the shape is not recognised it
defaults to a domain, which you can correct on the asset’s Details tab.
For anything larger than a handful of values, you have better options than typing:
- import a scanner export, which creates assets and observations in one pass (see Importing scanner output)
- run the built-in scan engine (see Ports and the scan engine)
- hand the customer’s scope list to your agent and let it enter them
Filtering
The filter box matches on the asset value or its label. The chips beside it narrow to one kind: All, Domain, IP, URL, API, Mobile.
Filters live in the URL, so the current view is always linkable.
The three tables
The page splits assets into three tables.
In scope is the working list: assets that are in scope and either marked reachable or not marked at all. This is the remaining workload, and it is the number shown on the Assets tab in the header.
Host down / blocked holds in-scope assets you have flagged as unreachable or WAF-blocked. They are still in scope, just not the next thing to work on. Clear the marking and they move back up.
Out of scope, do not test holds everything excluded. Keeping excluded assets visible means there is always an answer to “why is this not in my list”, instead of the asset having quietly disappeared a week ago.
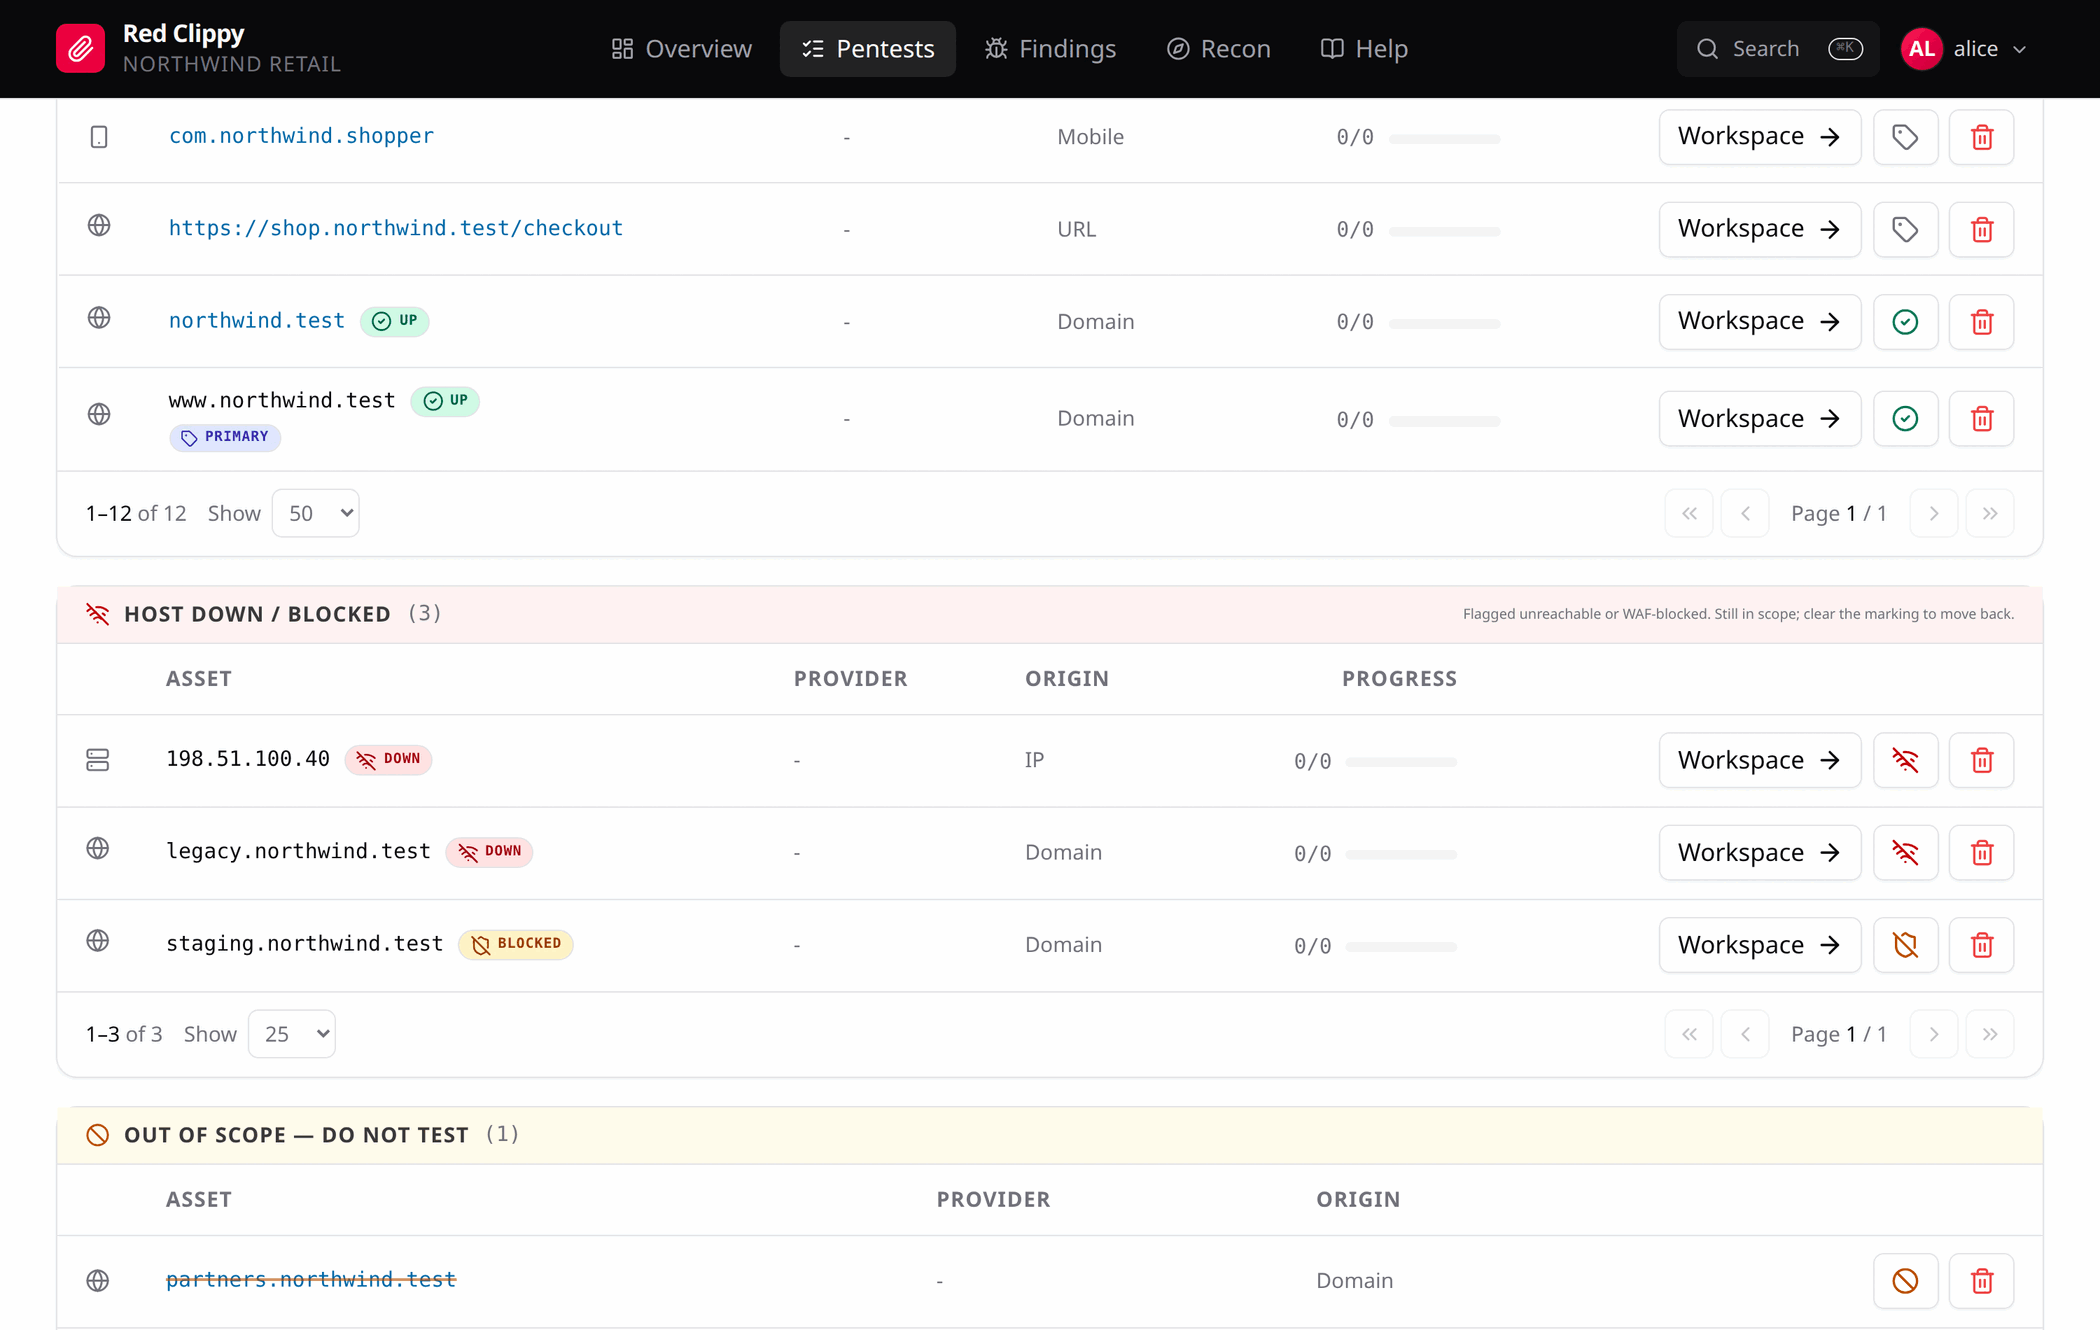
Each table paginates independently, so paging through out-of-scope entries does not disturb your position in the main list.
The columns
| Column | Meaning |
|---|---|
| Asset | The value, plus badges: reachability, label chip, alias link, API count. |
| Provider | Who hosts it (Cloudflare, AWS, Akamai). Useful for spotting third-party infrastructure at a glance. |
| Origin | The asset kind. |
| Progress | Checks done over checks total for this asset. 0/0 means you have not opened its Methodology tab yet, which is what creates the checklist. |
Three controls sit at the end of each row. Workspace opens the asset, the round button opens the marking picker, and the red button deletes.
Deleting an asset removes it, its observations and its check results. Findings
tagged asset:<value> are kept, so an accidental delete does not take your
report with it. You delete those separately from the Findings page.
Marking scope and reachability
The round button on each row opens a picker with the available markings:
| Marking | When |
|---|---|
| Reachable | The host answers. |
| Host down | Probes do not connect at all. |
| Getting blocked | A CDN or WAF is short-circuiting your requests. Different problem, different fix. |
| Unknown | Clears the marking. |
| Out of scope | Excludes the asset from testing and moves it to the bottom table. |
Marking something out of scope also clears its reachability, because it is not going to be probed either way.
The same fields, plus a note, are on the asset’s Details tab, where you can
record the evidence for the marking (Cloudflare 1020,
ECONNREFUSED 80/443). The note stops the same host being re-probed by three
different people over a week.
Labels
A label is a short tag of your own choosing: primary, revisit,
client-confirmed. It renders as a coloured chip in the table and beside the
asset title.
Clicking a chip filters the whole page to everything sharing that label, and clicking it again clears the filter. Labels are free text with a 40-character limit, set on the asset’s Details tab.
Asset details
Open an asset and choose Details.
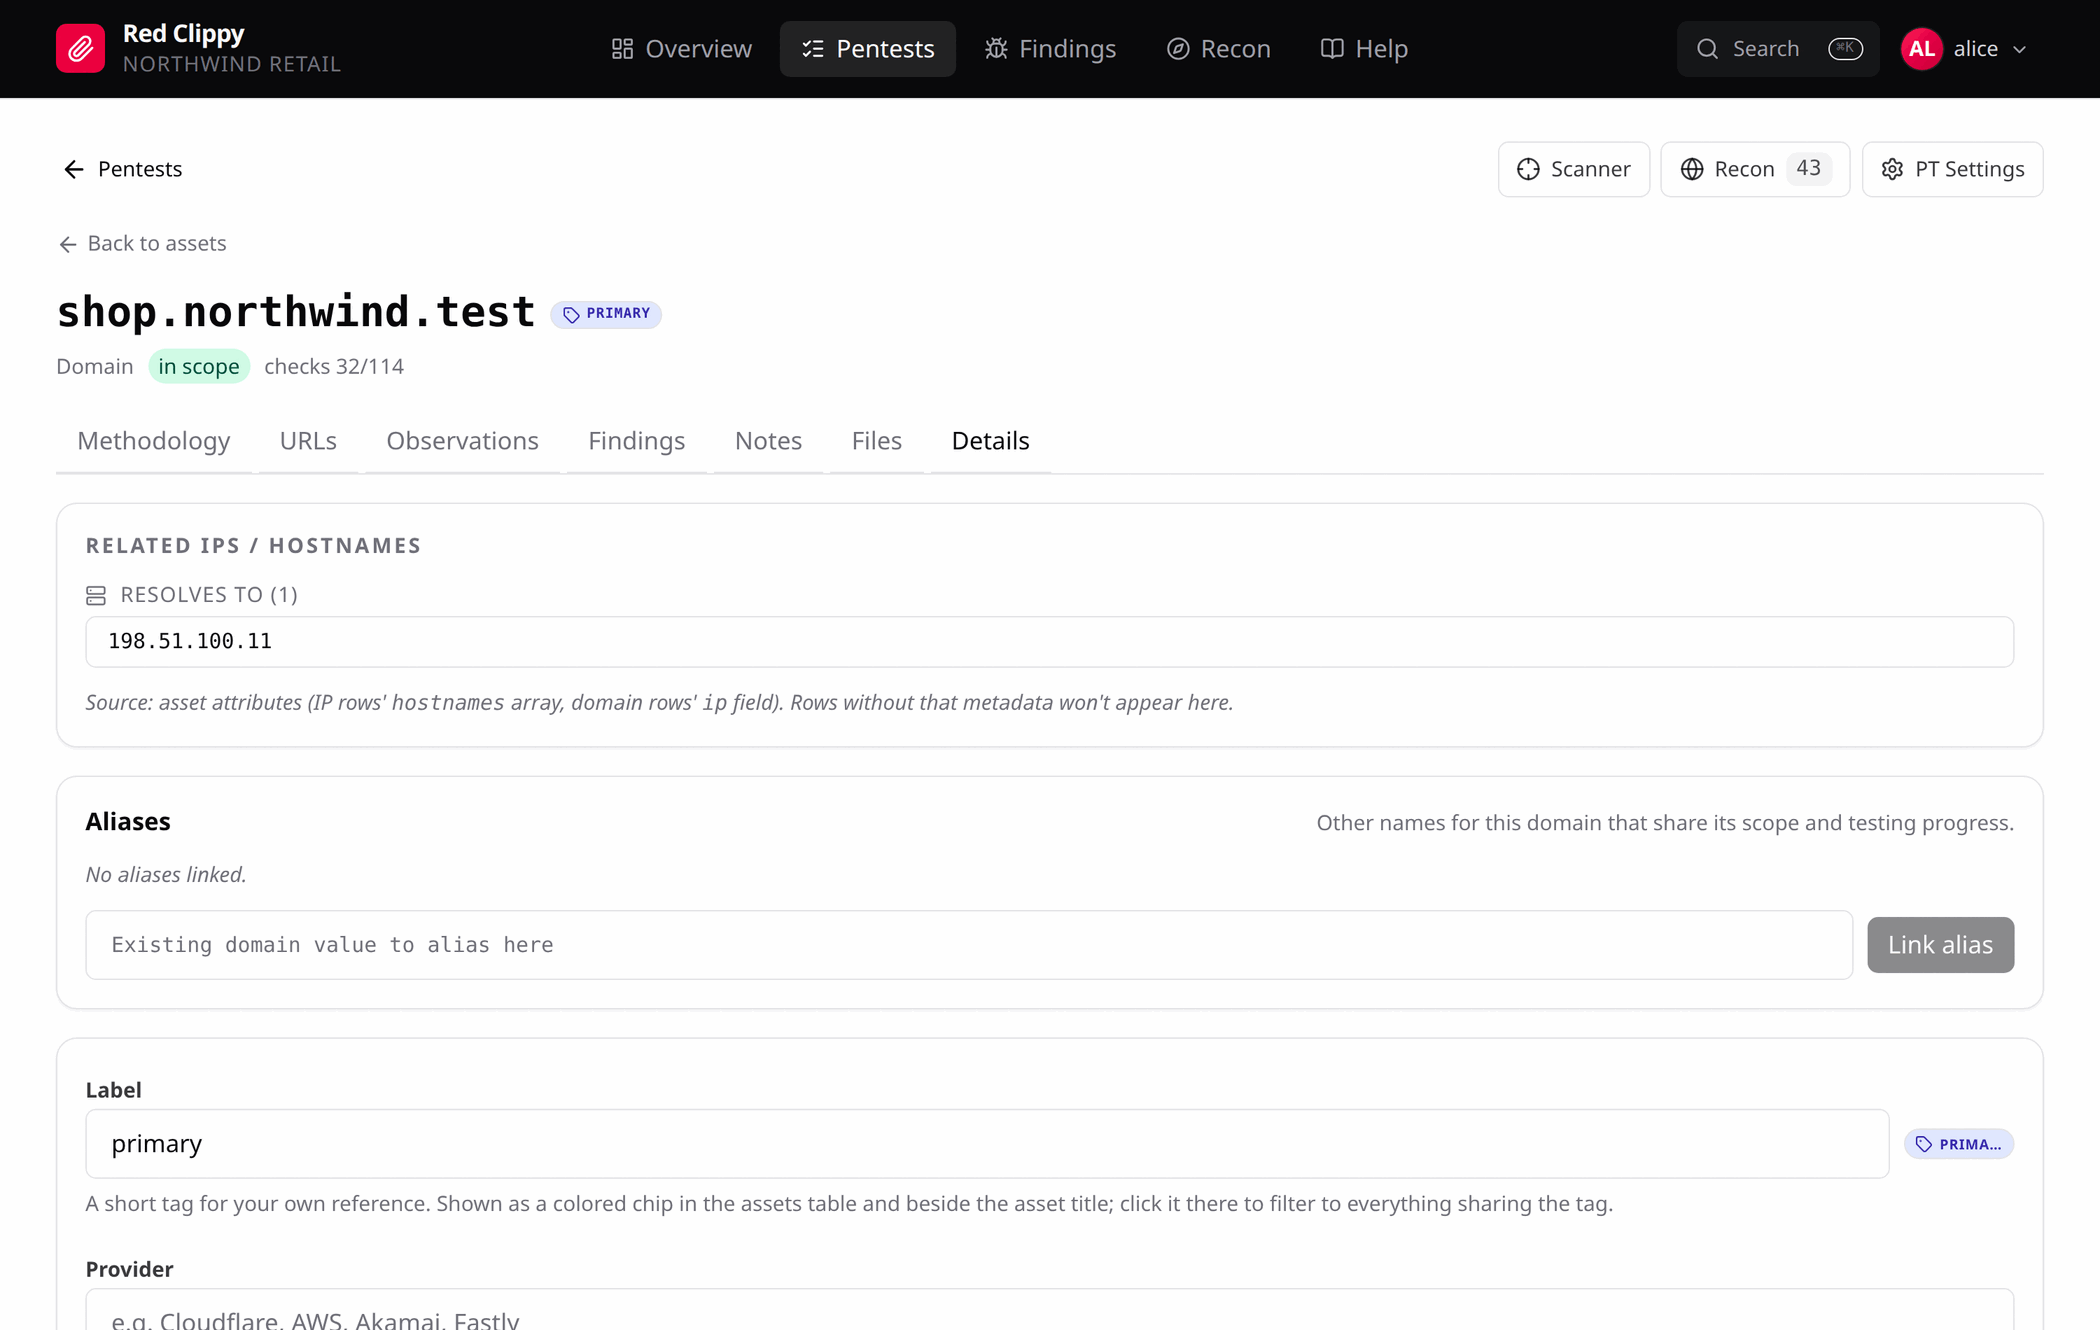
Four things live here.
Related IPs / hostnames shows what this asset resolves to, read from asset attributes that scanner imports populate. A domain lists the IPs behind it; an IP lists the hostnames pointing at it. Rows imported without that metadata do not appear.
Aliases record that two names are the same target. Link
www.example.com as an alias of example.com and it inherits the
canonical’s scope and reachability, and no longer needs testing of its own. The
alias row still exists and is still searchable, but testing the canonical now
covers both.
Label, Provider and Organization are free-text metadata. Set Organization only when the asset is owned by someone other than the engagement’s customer. That is usually the sign of a third-party host which should probably be out of scope.
Reachability and the Out of scope checkbox are the same markings as the row picker, with room for the note.
The Recon drawer
The Recon button in the engagement header opens a side drawer over whatever page you are on.
It lists the engagement’s observations grouped by kind, with a search box and a kind filter, and a small add form at the top. The add form is kind-aware: pick one of the five asset kinds and it creates an asset, pick anything else and it creates an observation attached to the matching asset.
The drawer shows at most 200 rows, and says so when it has cut the list short. For anything bigger, use the Assets tab or the asset’s own Observations tab. Both paginate properly.
The network view
The Network tab answers two questions at once: what perimeter the customer declared, and what the address space you have actually found looks like.
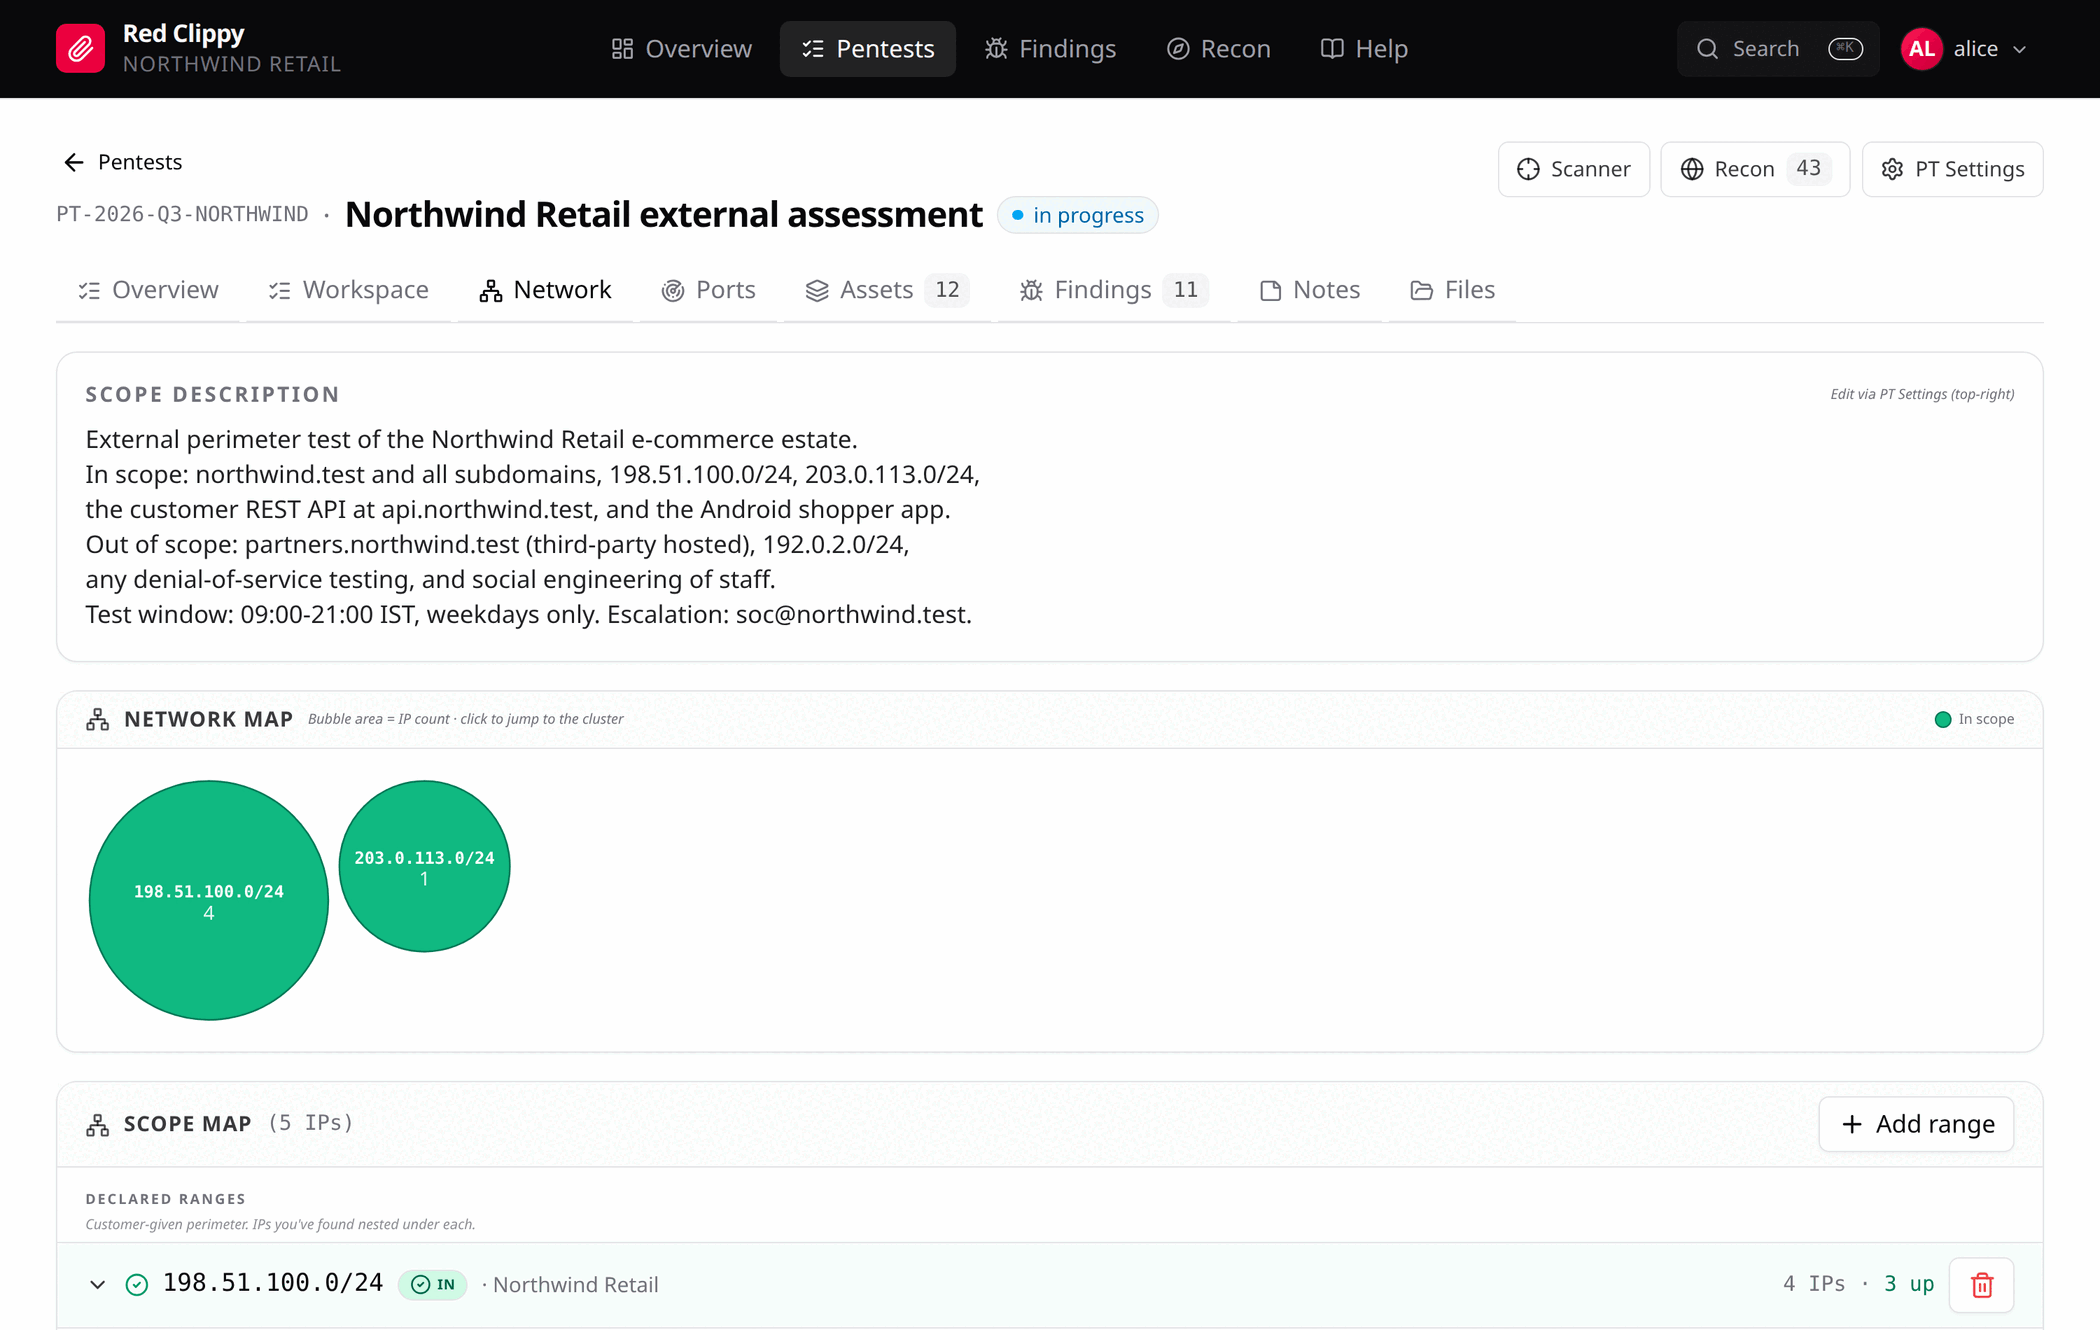
Scope description
The card at the top is the free-text scope from PT Settings, reproduced here because this is the page where you decide what is in and what is out. Edit it with the PT Settings button in the header.
The network map
Every bubble is a cluster of IP addresses, with area proportional to how many addresses it holds, biggest first. Clicking one scrolls the tree below to the matching row and highlights it.
| Colour | Meaning |
|---|---|
| Green | A declared in-scope range. |
| Blue | A discovered cluster: addresses you have found that fall in no declared range. These still need a scope decision. |
| Indigo | A loose /16: many /24 blocks each holding one or two addresses, which is the shape a CDN makes. |
| Grey | The singletons bucket. |
Declared out-of-scope ranges are deliberately not drawn. The map is for finding targets, and exclusions are not targets. They still appear in the tree below for the record.
The scope map
Below the map is the tree, in three sections.
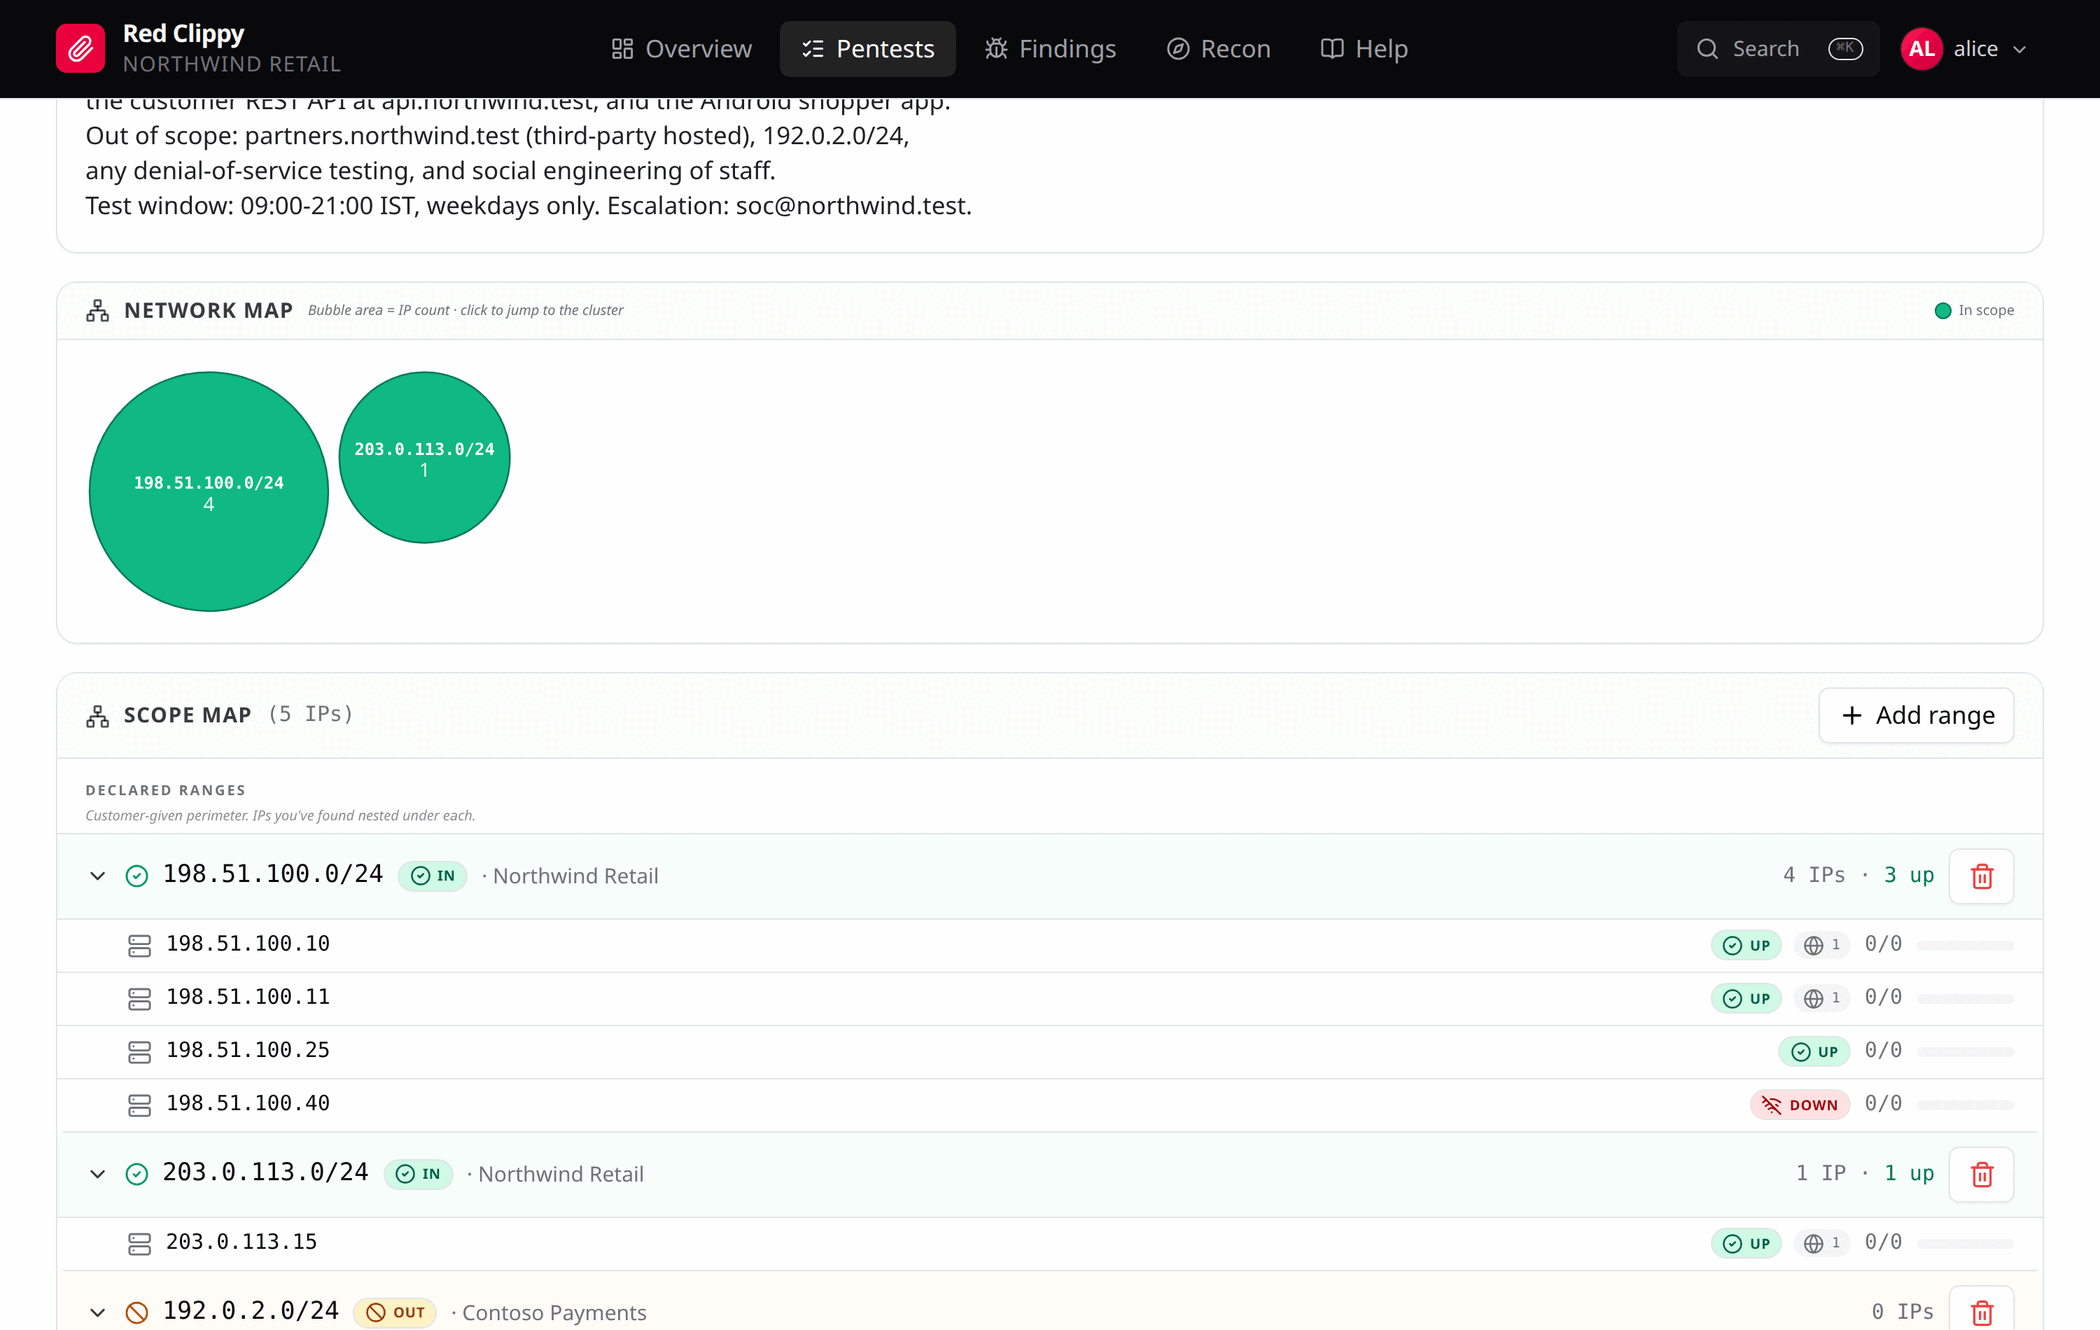
Declared ranges are the CIDRs from the engagement letter, each marked IN
or OUT, with the addresses you have discovered nested underneath. Expand a
row to see each member IP with its reachability and check progress, which
explains the “4 IPs, 3 up” summary on the row itself. A wide range such as a
/16 gets an extra /24 fold, so the customer’s perimeter and your actual
coverage line up visually.
Add range opens a dialog for a CIDR, its in or out marking, and optional ASN, organization and notes. This is where the engagement letter gets typed in.
Discovered clusters group addresses that fall in no declared range, by
/24, biggest first. Each has In and Out buttons. Pressing one records
the /24 as a declared range and applies that scope decision to every member
address at the same time. This is the quickest way to deal with a recon sweep
that turned up several unfamiliar blocks.
Singletons are /24 blocks holding a single address. They sit in a
collapsed bucket at the bottom, where they cannot crowd out the larger clusters.
Deleting a range
Deleting a declared range removes the range record only. No asset rows are touched, and any out-of-scope markings already applied to member addresses stay where they are. If you want those cleared too, clear them per address on the Assets page.
This is deliberate. Removing a line from the engagement letter should not silently pull a host back into testing.
Workspace and coverage
The Workspace tab is where testing is actually recorded. It has two modes. With no asset selected it tracks the engagement as a whole. Focus an asset and it becomes that asset’s testing surface.
Engagement phases
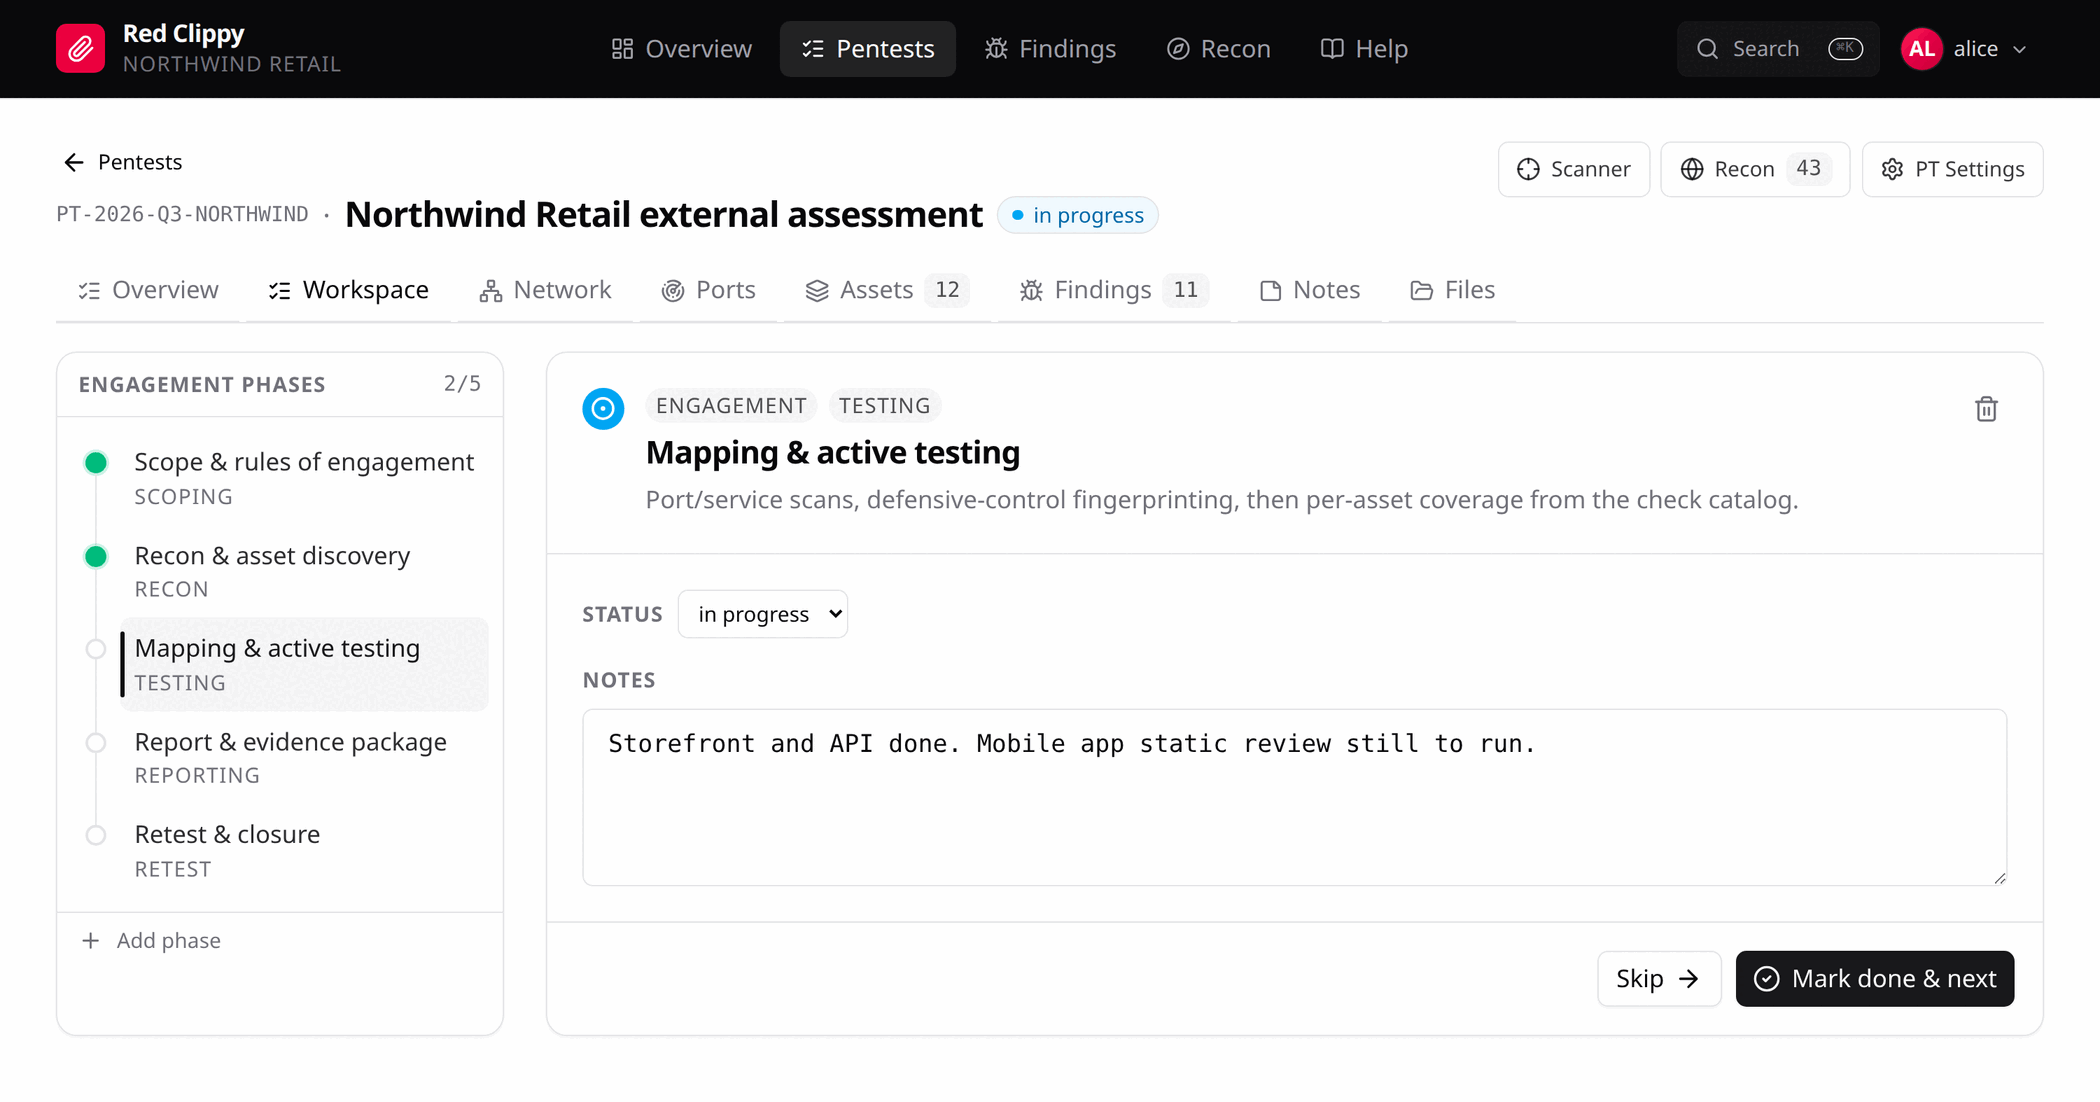
The left column lists the phases as a vertical timeline. Five are seeded with every pentest:
| Phase | Category | What it covers |
|---|---|---|
| Scope & rules of engagement | scoping | In-scope assets, exclusions, test windows, escalation contacts, retest policy. |
| Recon & asset discovery | recon | Subdomains, DNS records, ASN and IP ranges, certificate transparency, cloud assets, leaked secrets. |
| Mapping & active testing | testing | Port and service scans, control fingerprinting, then per-asset coverage. |
| Report & evidence package | reporting | Writeups with CVSS, impact, repro steps and evidence. |
| Retest & closure | retest | Retest fixed findings, close out, archive per the retention policy. |
The counter in the header (2/5) counts phases that are done or na.
Add phase at the bottom adds your own with a title and optional category.
The right pane is the selected phase: its status dropdown, a notes box, and two buttons. Mark done & next resolves the phase and jumps to the next unresolved one. Skip moves on without changing anything.
Notes save when the box loses focus, or on Ctrl+S. There are only five phases
and they last the whole engagement, so this is where the durable notes belong:
“client confirmed staging is behind the same WAF as production”.
Phases are deliberately coarse. Anything finer belongs in the per-asset checklist, where it can be tracked per target instead of once for the whole engagement.
Focusing an asset
Open an asset from the Assets page (Workspace on its row), from a finding’s affected-asset link, or from the command palette. The engagement tab strip is replaced by the asset’s own.
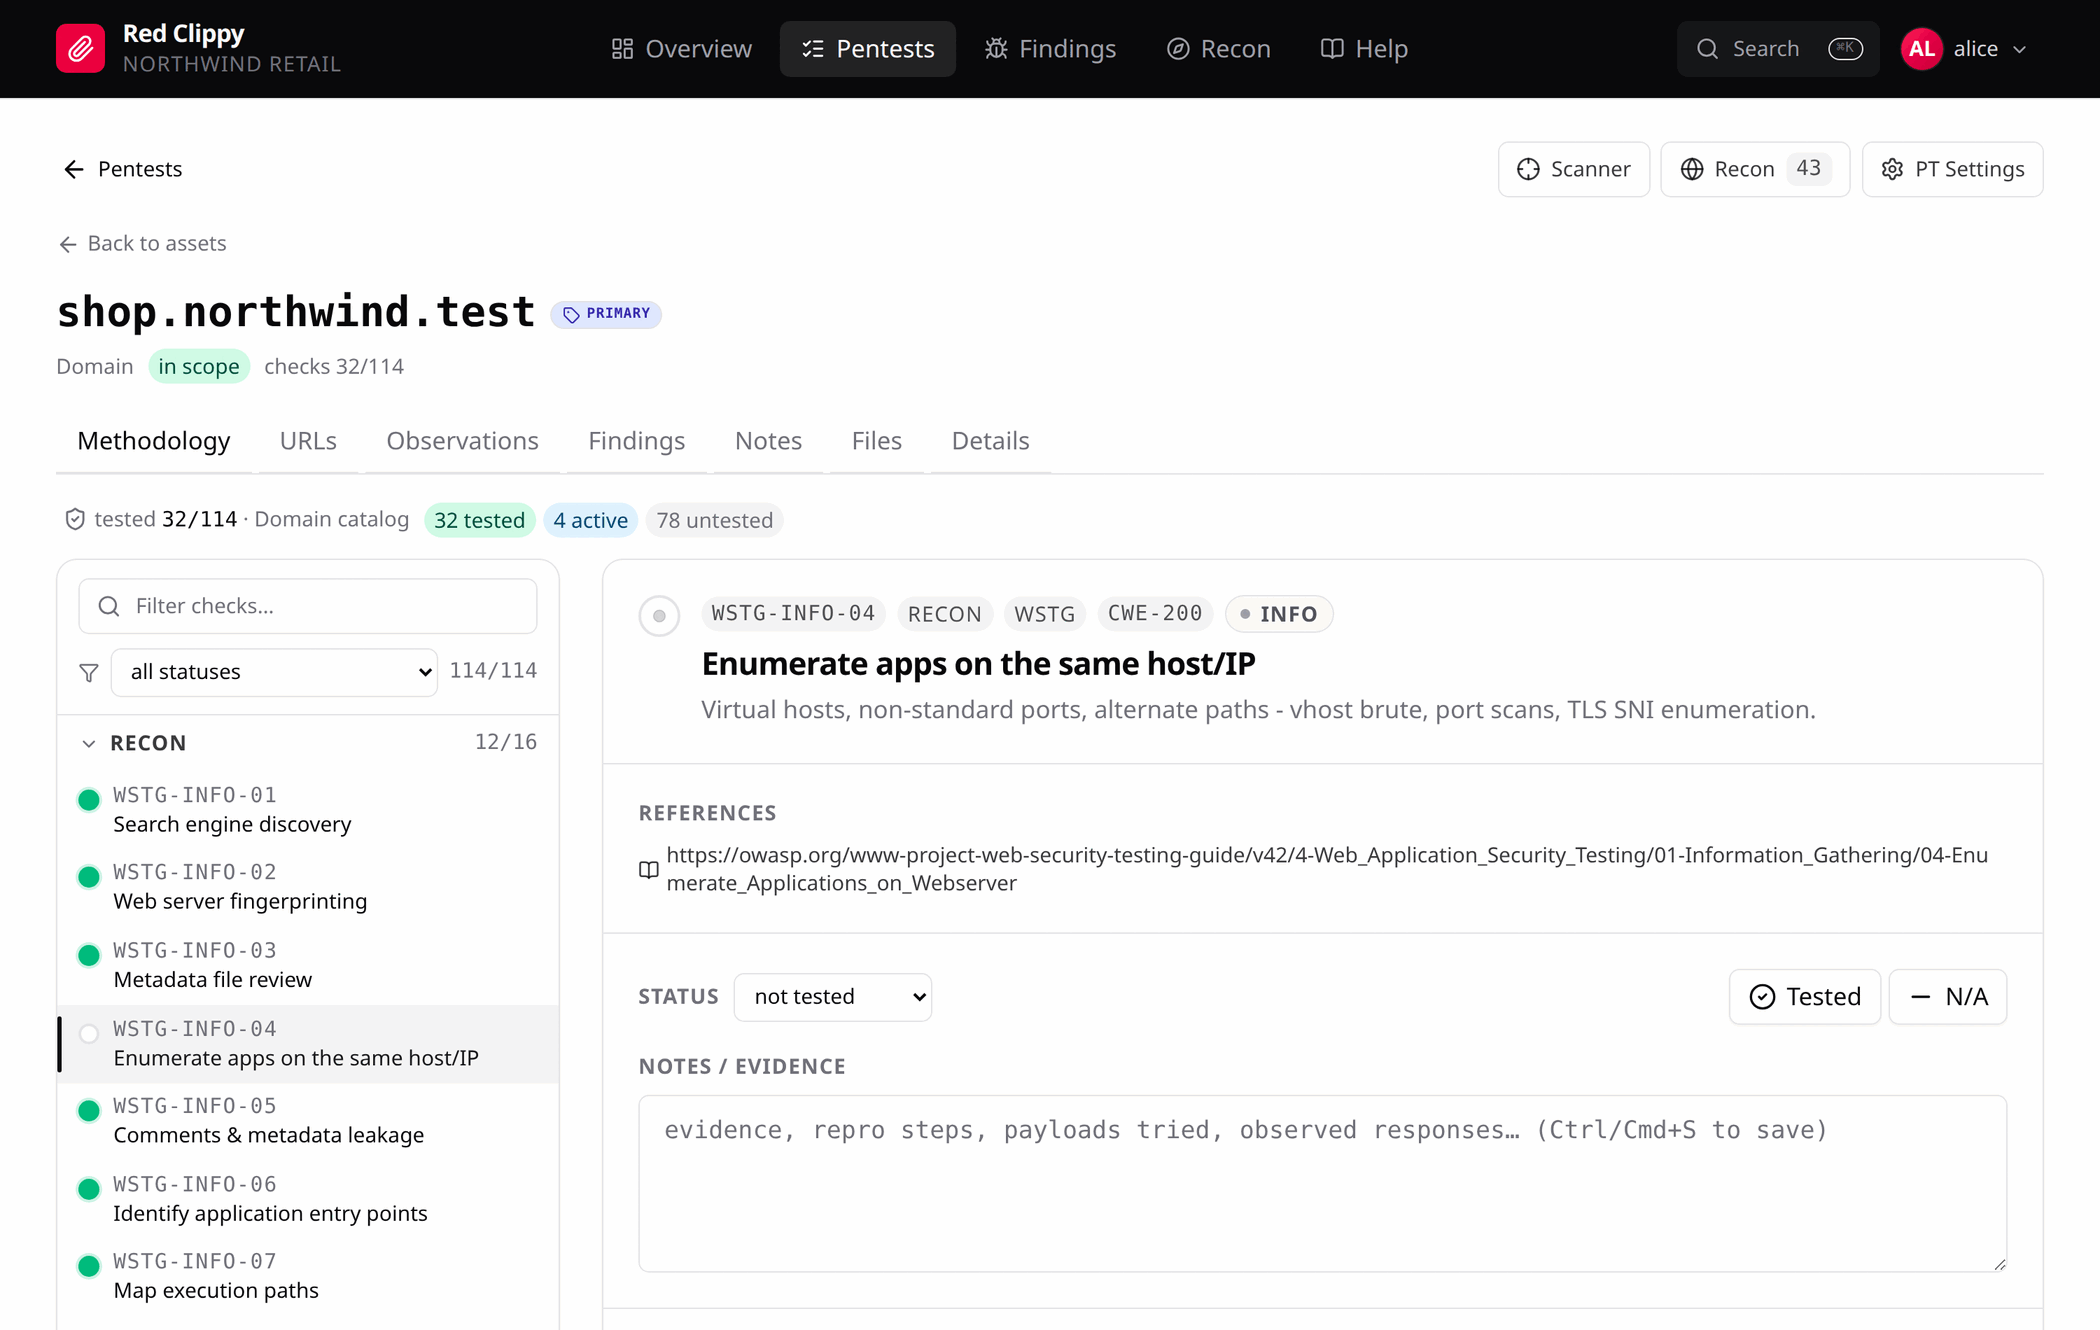
The title line shows the asset value, its kind, its scope state, its label if it has one, and its check progress. Tabs vary by kind:
| Tab | Shown for | What it holds |
|---|---|---|
| Methodology | all | The check catalogue for this asset. |
| URLs | domain, url | URLs discovered under this asset. |
| Endpoints | api | Structured API operations. |
| Ports | ip | Open ports on this host. |
| Observations | all | Everything else found here. |
| Findings | all | Findings tagged asset:<value>. |
| Notes | all | A notes field for this asset. |
| Files | all | This asset’s slice of the file area. |
| Import | ip only | Command hints and an upload box for scanner output about this host. |
| Details | all | Aliases, resolved addresses, label, provider, scope markings. |
Methodology
The coverage strip along the top counts the catalogue for this asset kind, then breaks it down: tested, n/a, active, blocked, untested.
The left column groups checks by category (recon, config, input, auth, authz, session, crypto, client, business logic, cloud) with a progress count on each. Only the group holding the selected check is expanded, which keeps the list short on a domain with 114 checks. Above it sit a text filter and a status filter, with a counter showing how many checks match.
Selecting a check fills the right pane with everything needed to work through it:
- the check code, category, standard (WSTG, API Top 10, CIS, PTES), CWE and suggested severity
- the description and the reference links, which go to the source methodology
- a status dropdown, plus Tested and N/A buttons for the two common answers
- a notes and evidence box, saved on blur or
Ctrl+S - the findings already tagged for this check, and a one-line form to log another
Next untested at the bottom moves to the next unresolved check in the current filter, so the page can be worked as a queue.
Marking a check not_applicable counts as resolved. Use it. “We looked and
there is no file upload here” is a real testing outcome, and it belongs in the
record rather than in the untested pile forever.
Quick-logging a finding from a check
The form at the bottom of the check pane takes a title and a severity and
creates a finding tagged with both asset:<value> and check:<code>. Severity
is pre-filled from the check’s suggested severity and the check’s CWE is
copied over. You are then taken to the finding detail page to fill in the rest.
Those two tags are why the finding then appears under this check and on the asset’s Findings tab.
Observations
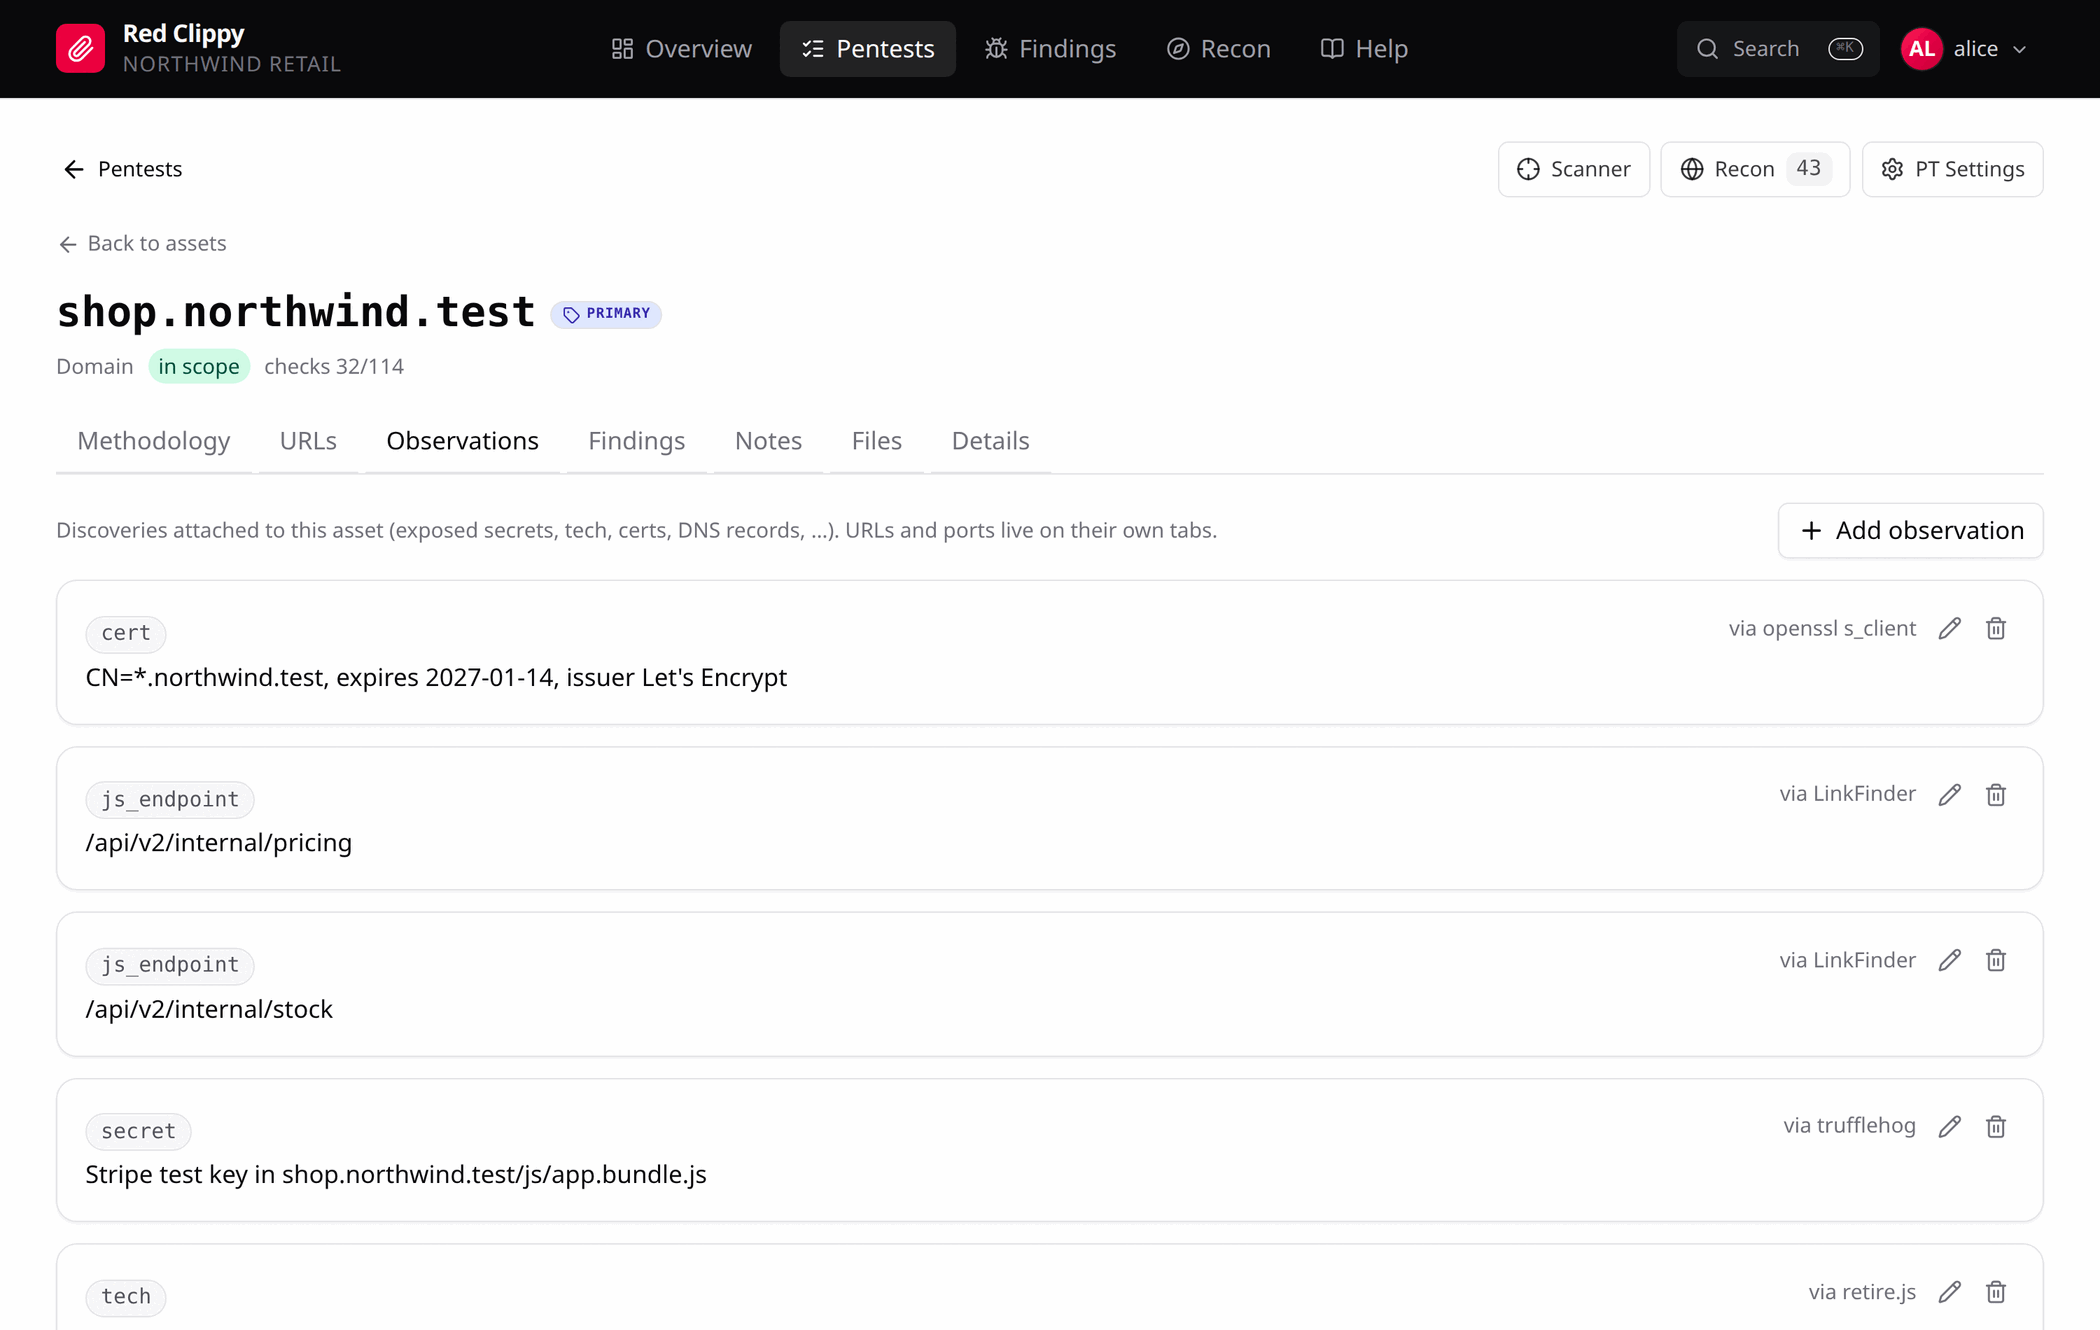
This tab holds everything discovered about the asset that is not a URL, a port or a finding. Each row shows its kind, its value and the source you recorded, and can be edited or deleted in place. Add observation takes a kind, a value and an optional source.
Content discovery output, technology fingerprints, certificates, DNS records,
leaked secrets and takeover candidates all belong here. Keeping them out of the
asset list is why one ffuf run does not make the scope list unusable.
URLs
For a domain or URL asset, the URLs tab lists paths discovered under it, with search, pagination, bulk import and export.
Additions are validated against the asset they are being added to. A URL whose host does not match, or whose path falls outside a path-scoped asset’s prefix, is rejected with a message telling you where it does belong. Without that check, URLs land under an asset they will never be attributed to and quietly disappear.
Import from previous PTs pulls the URLs recorded for this same host in the organization’s earlier engagements, grouped by the engagement they came from and excluding anything already present here. On a repeat client this saves re-running content discovery to find the paths you already know about, and it shows you at once whether a path you reported last round is still there.
Endpoints
An api asset gets a structured catalogue of operations instead of a flat URL
list.
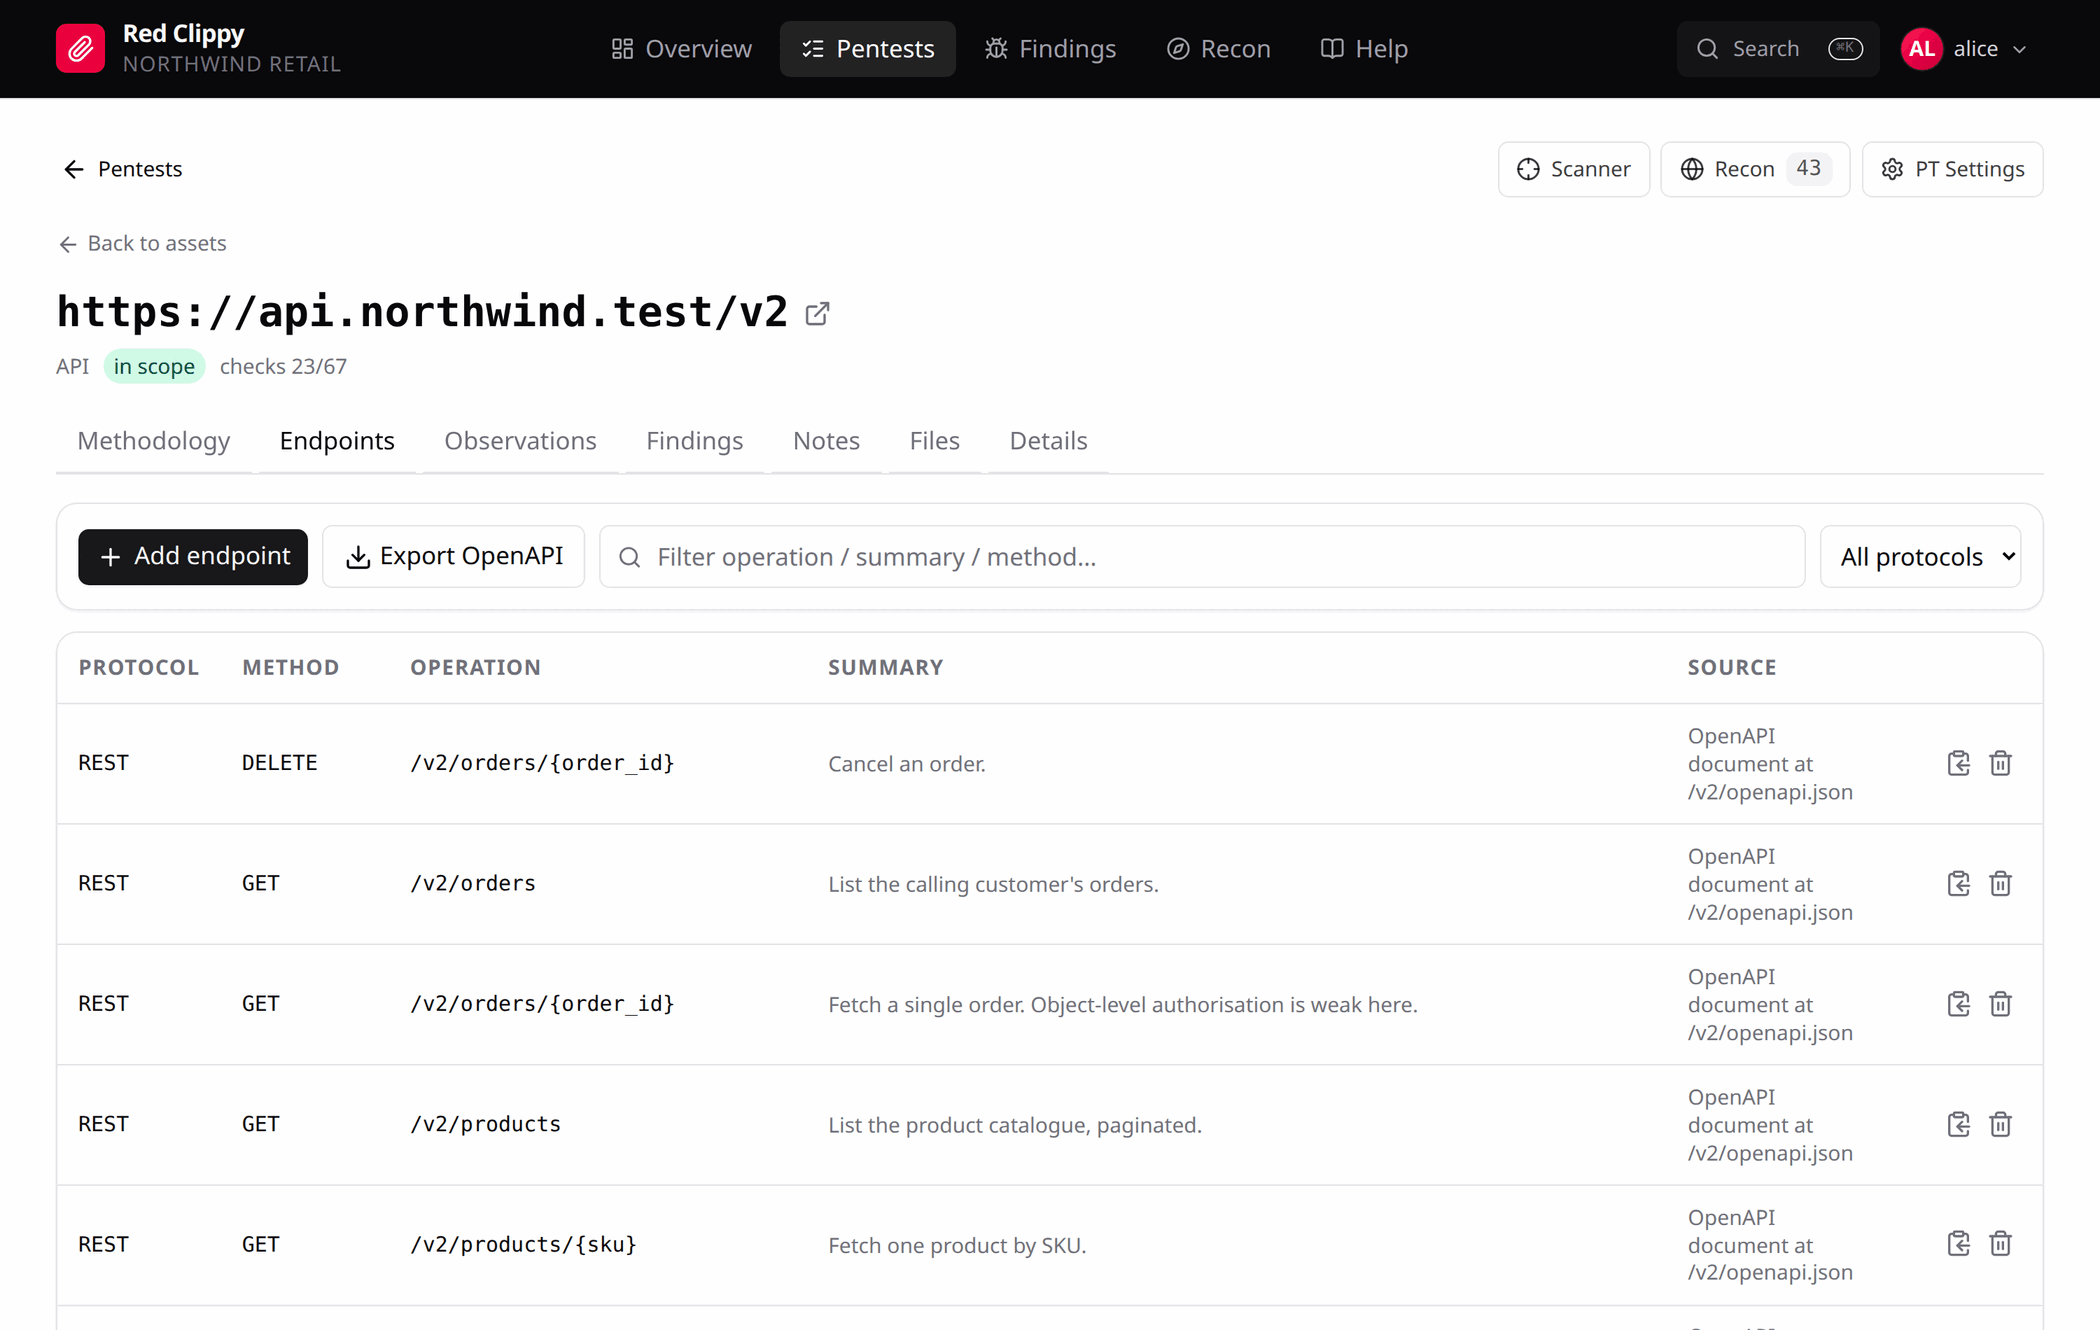
Each row carries protocol (REST, GraphQL, SOAP, gRPC), method, operation path, summary and source, and can hold query parameters, headers, and request and response bodies. The icons at the end of a row copy the endpoint as a cURL command or delete it.
Export OpenAPI produces an OpenAPI document for the whole asset, which is useful for feeding the API into another tool. Add endpoint adds one by hand. The REST API and MCP both have a bulk call for importing a whole specification at once.
Ports, Notes, Files, Details
Ports appears on IP assets and lists what is open on that host. Adding or editing a port matches on host, port and protocol, so re-importing a scan updates the existing rows instead of duplicating them.
Notes is a per-asset text area. Files is the asset’s slice of the engagement file area, with the same browser as the Files tab. Details is covered in Scope and assets.
Findings
A finding is something you are prepared to put in the report. Anything you cannot yet defend belongs in an observation or a note until you can.
The list
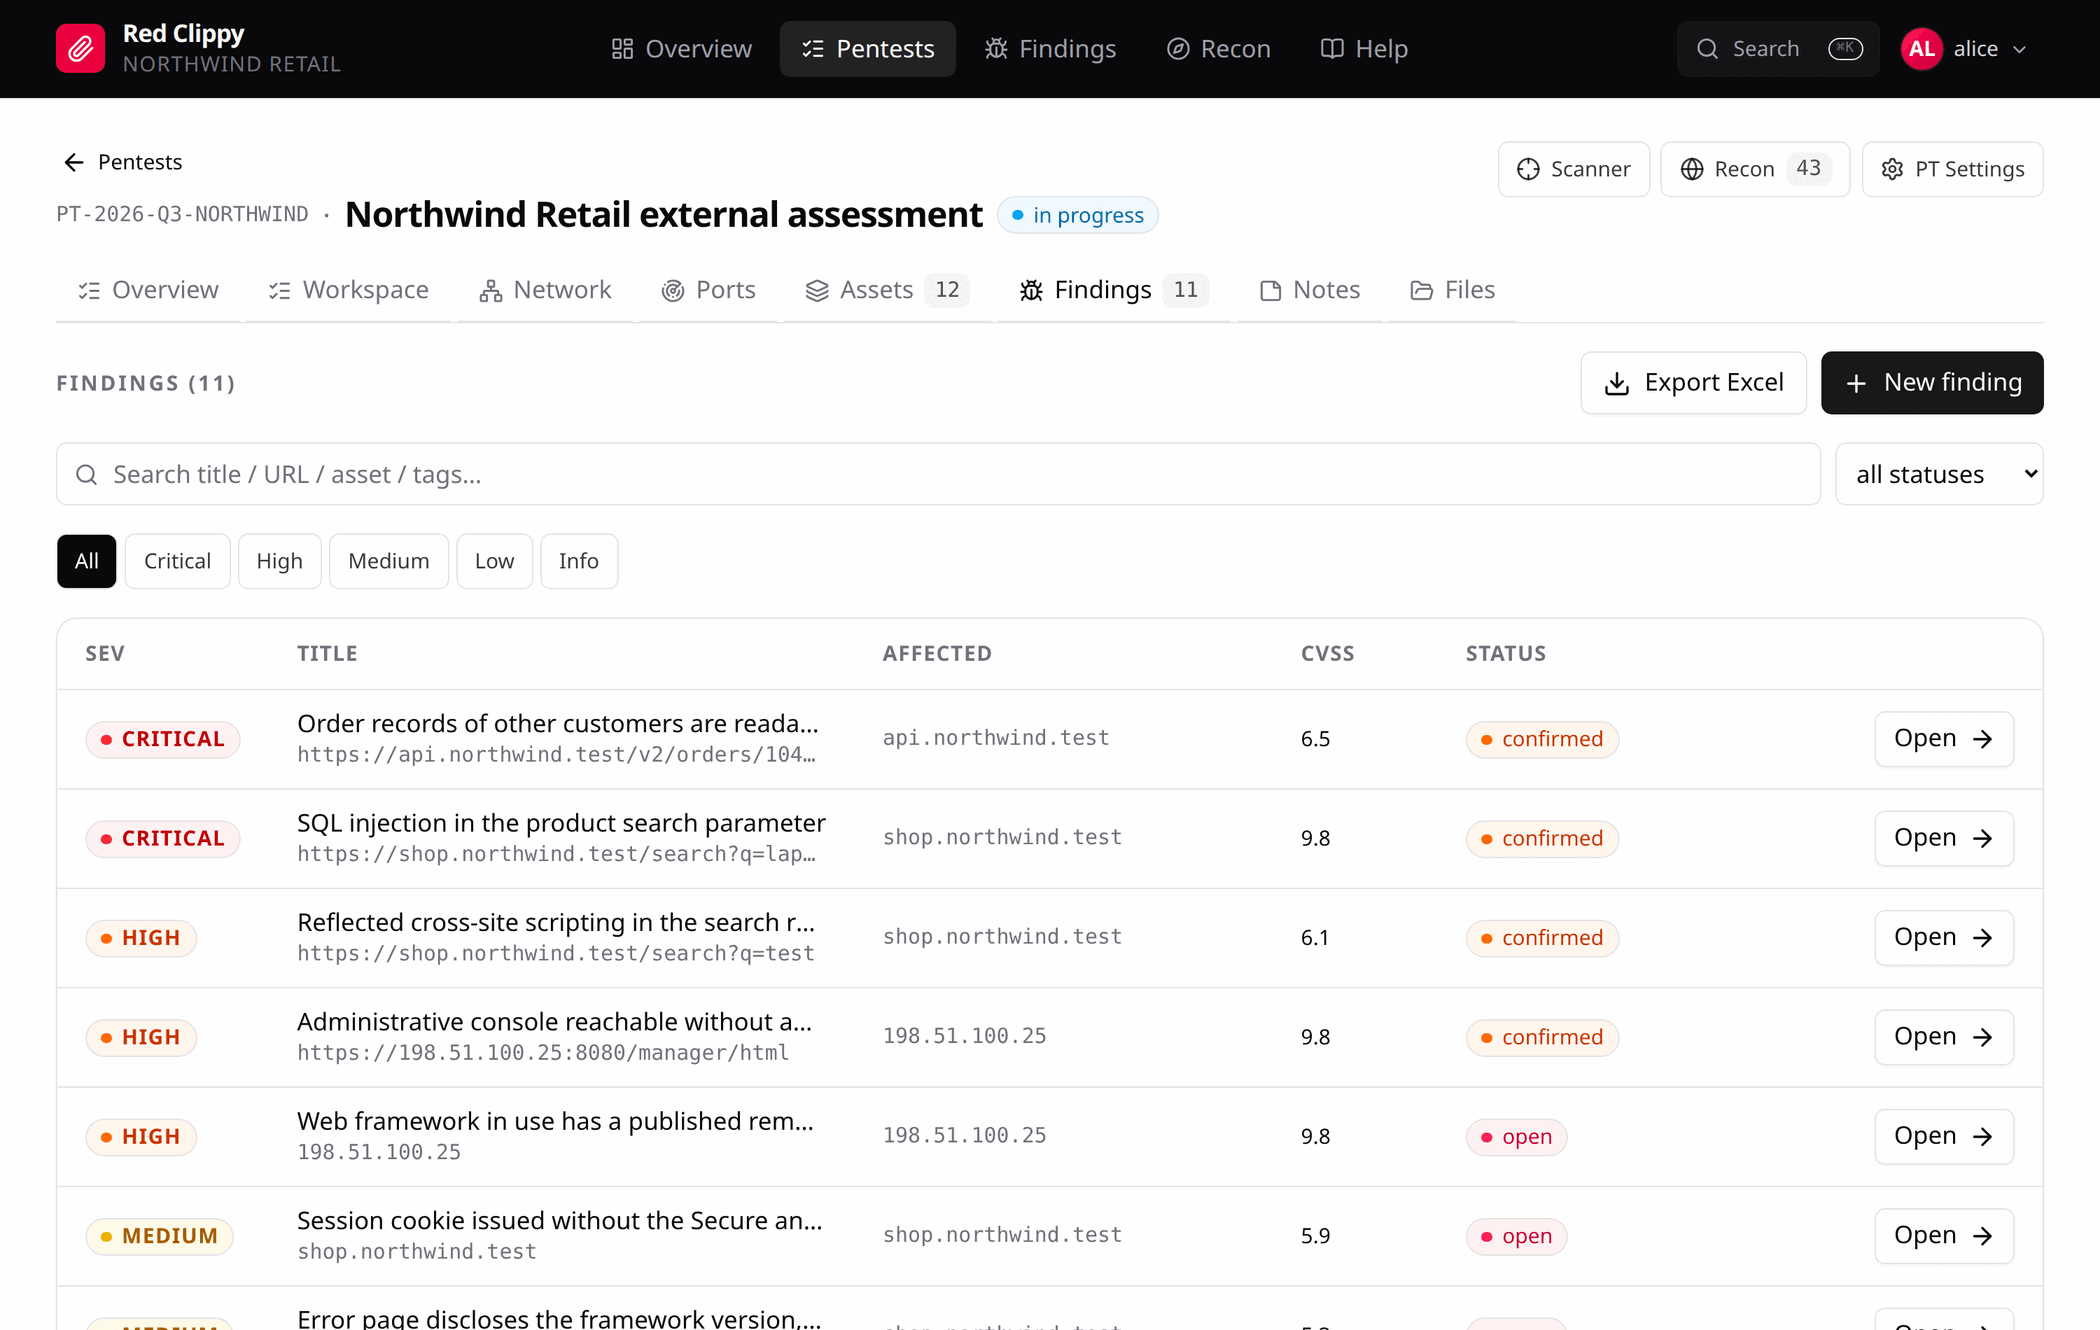
Findings are sorted by severity first, then newest first, so critical work is always at the top. Filters live in the URL, so a filtered view is linkable and the back button works.
The search box matches title, URL, affected asset and tags. Clicking the active severity chip clears it.
The Affected column links to that asset’s workspace, the quickest way from a finding back to the rest of what you know about the host.
Export Excel downloads the current filter, not the whole list.
The finding form
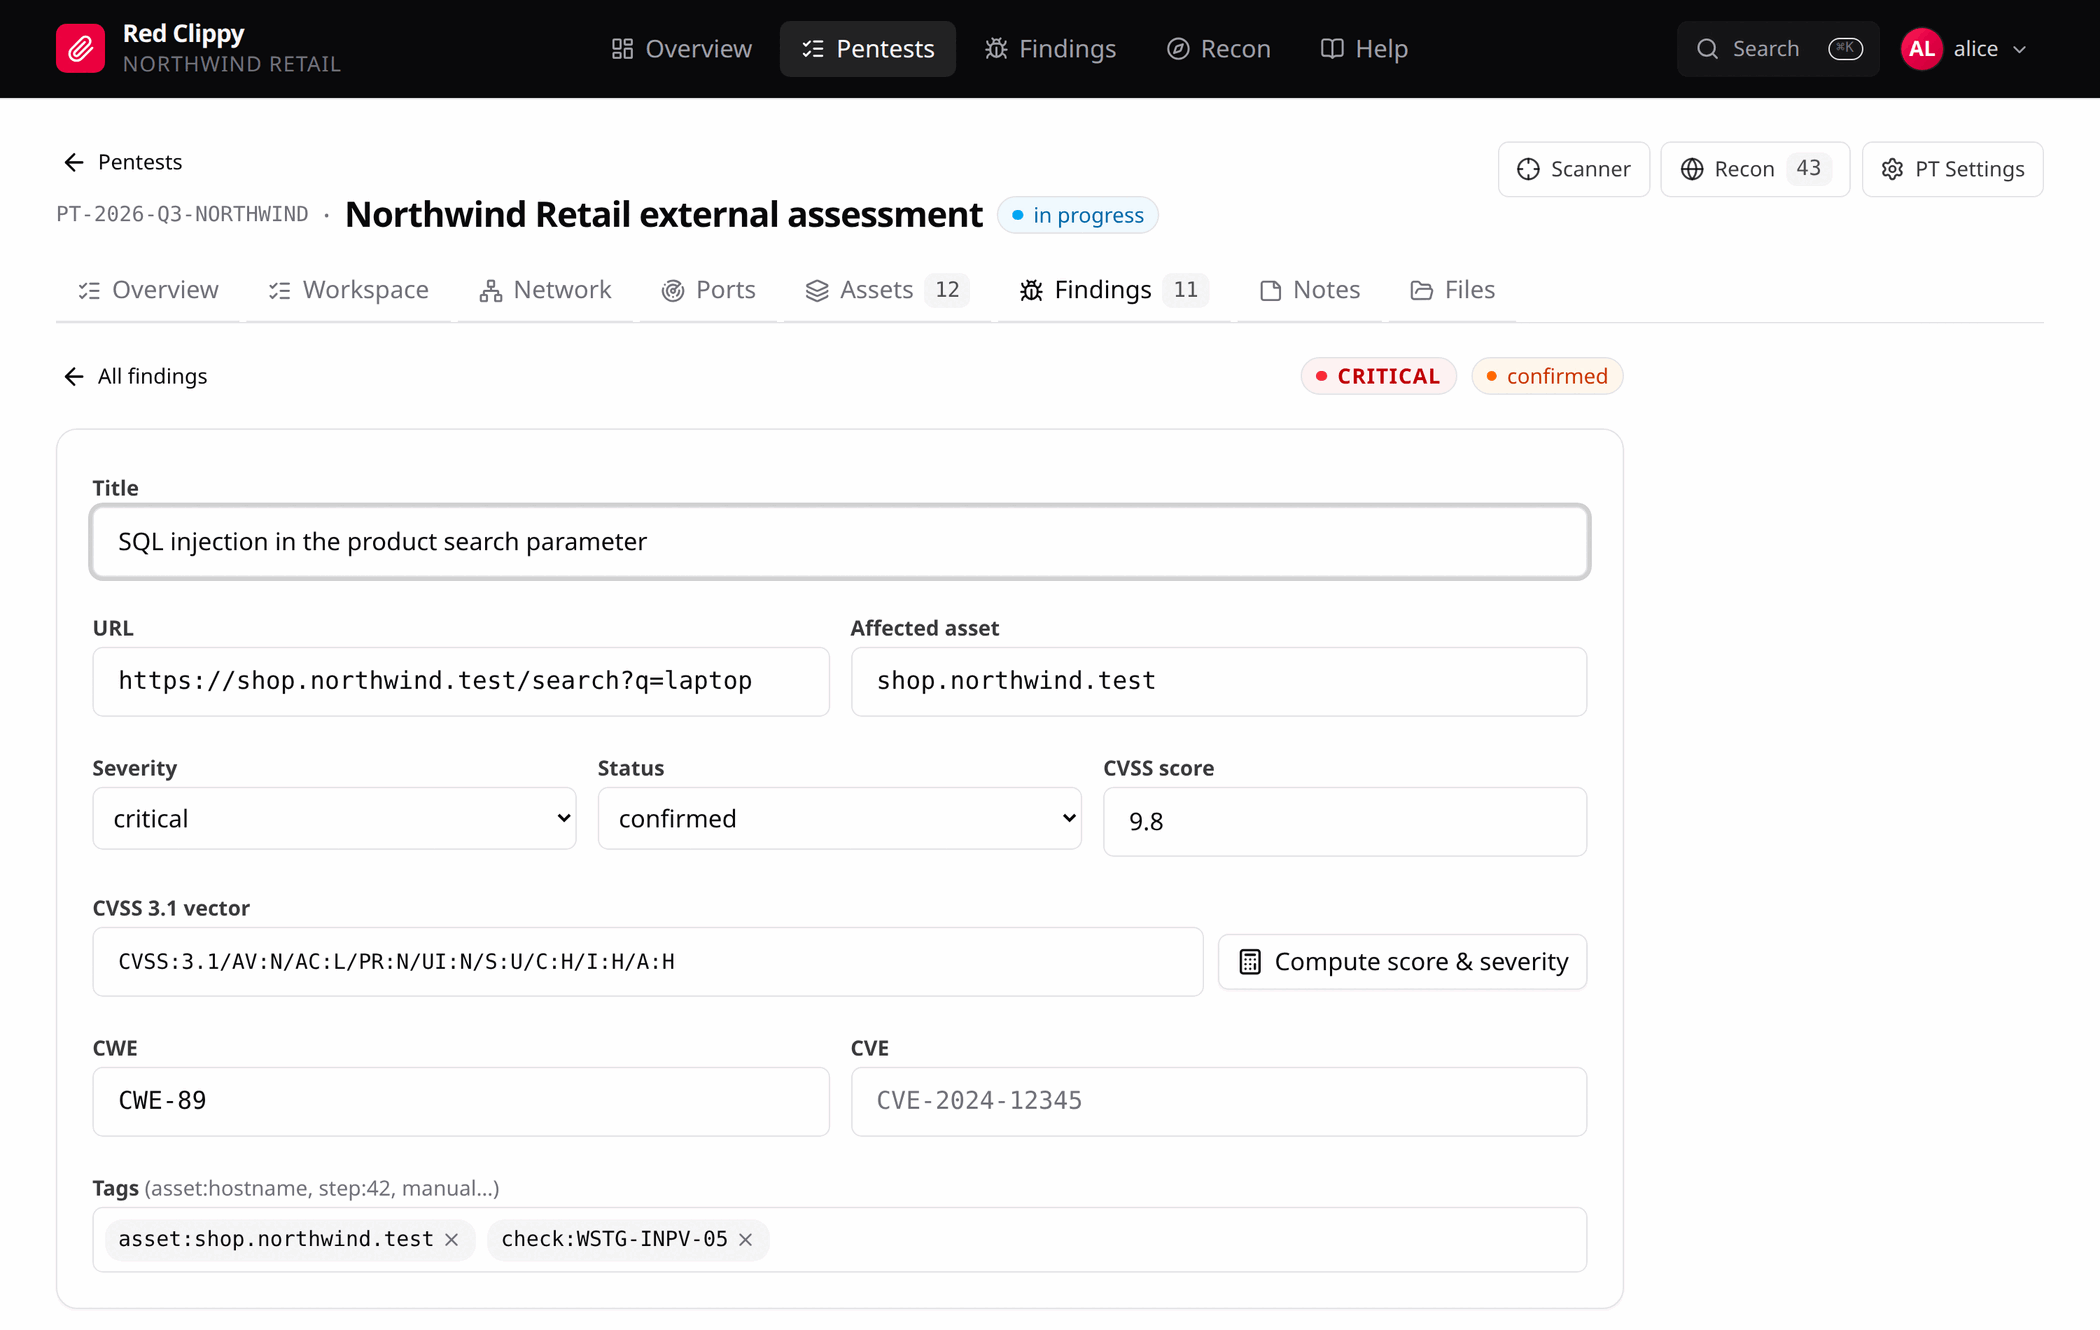
The first card is the classification:
| Field | Notes |
|---|---|
| Title | Required. Describe the vulnerability class and the behaviour. Keep the host, path and product name out of it; they have their own fields, and a title that names one host is useless when the same bug turns up on three. |
| URL | Where it manifests, when there is a specific one. |
| Affected asset | Hostname, IP or component. This is what the Affected column links on. |
| Severity | critical, high, medium, low, info. |
| Status | open, confirmed, remediated, accepted, false positive. |
| CVSS score | 0.0 to 10.0. Fill it in by hand or let the calculator do it. |
| CVSS 3.1 vector | The vector string. |
| CWE / CVE | CWE-89, CVE-2024-12345. |
| Tags | Free-form chips. Type and press Enter, or type a comma. |
Compute score & severity parses the vector, writes the base score into the CVSS score field, and sets the severity to the matching band. Paste a vector from any source, press the button, and both derived fields match the vector instead of whatever was typed before.
Two tag conventions the panel understands:
asset:<value>puts the finding on that asset’s Findings tabcheck:<code>puts it under that catalogue check in the workspace
Anything else is yours to use as you like. retest-passed, unverified and
manual are all reasonable.
The four text fields
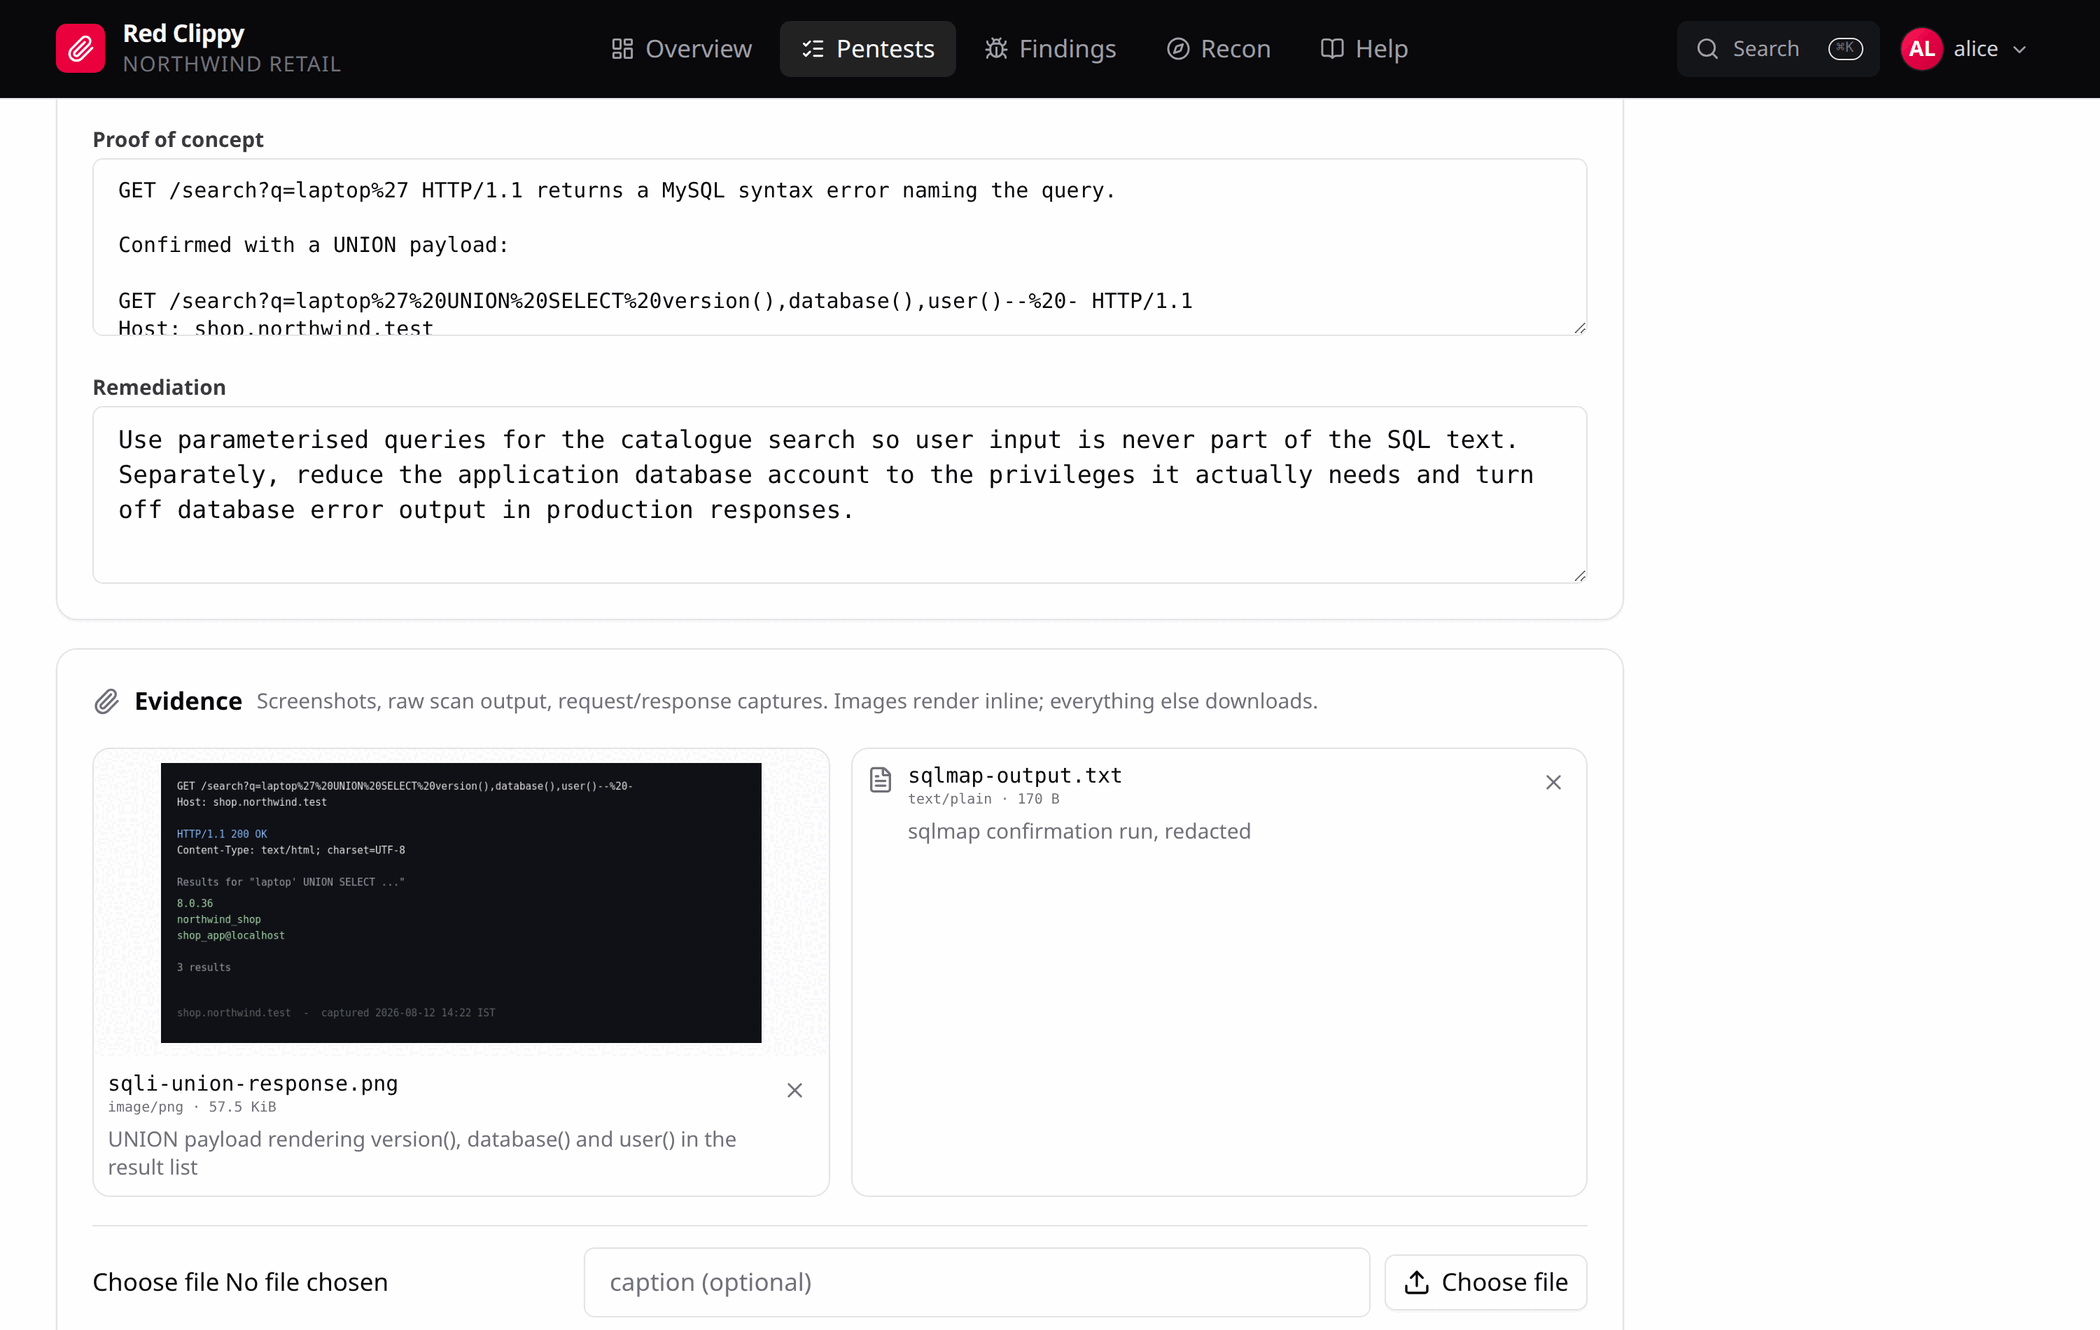
Four text areas, and they are not interchangeable:
Details is what is broken and where it shows up, in language a non-expert can follow. Not the exploit, not the fix, not a definition of the vulnerability class.
Impact is the concrete consequence: what data is exposed, what privilege is gained, what control is bypassed. Business impact, not exploit mechanics.
Proof of concept is the technical evidence. The request, the response excerpt, the payload, the stack trace. One self-contained request that proves the bug is worth more than five that circle it. Use triple backticks for blocks.
Remediation is what needs to change and what the end state looks like. Name the broken control. Resist writing the patch itself. Specific commands, config snippets and library versions are wrong often enough to cost you credibility, and the engineers reading the report know their own stack.
Evidence
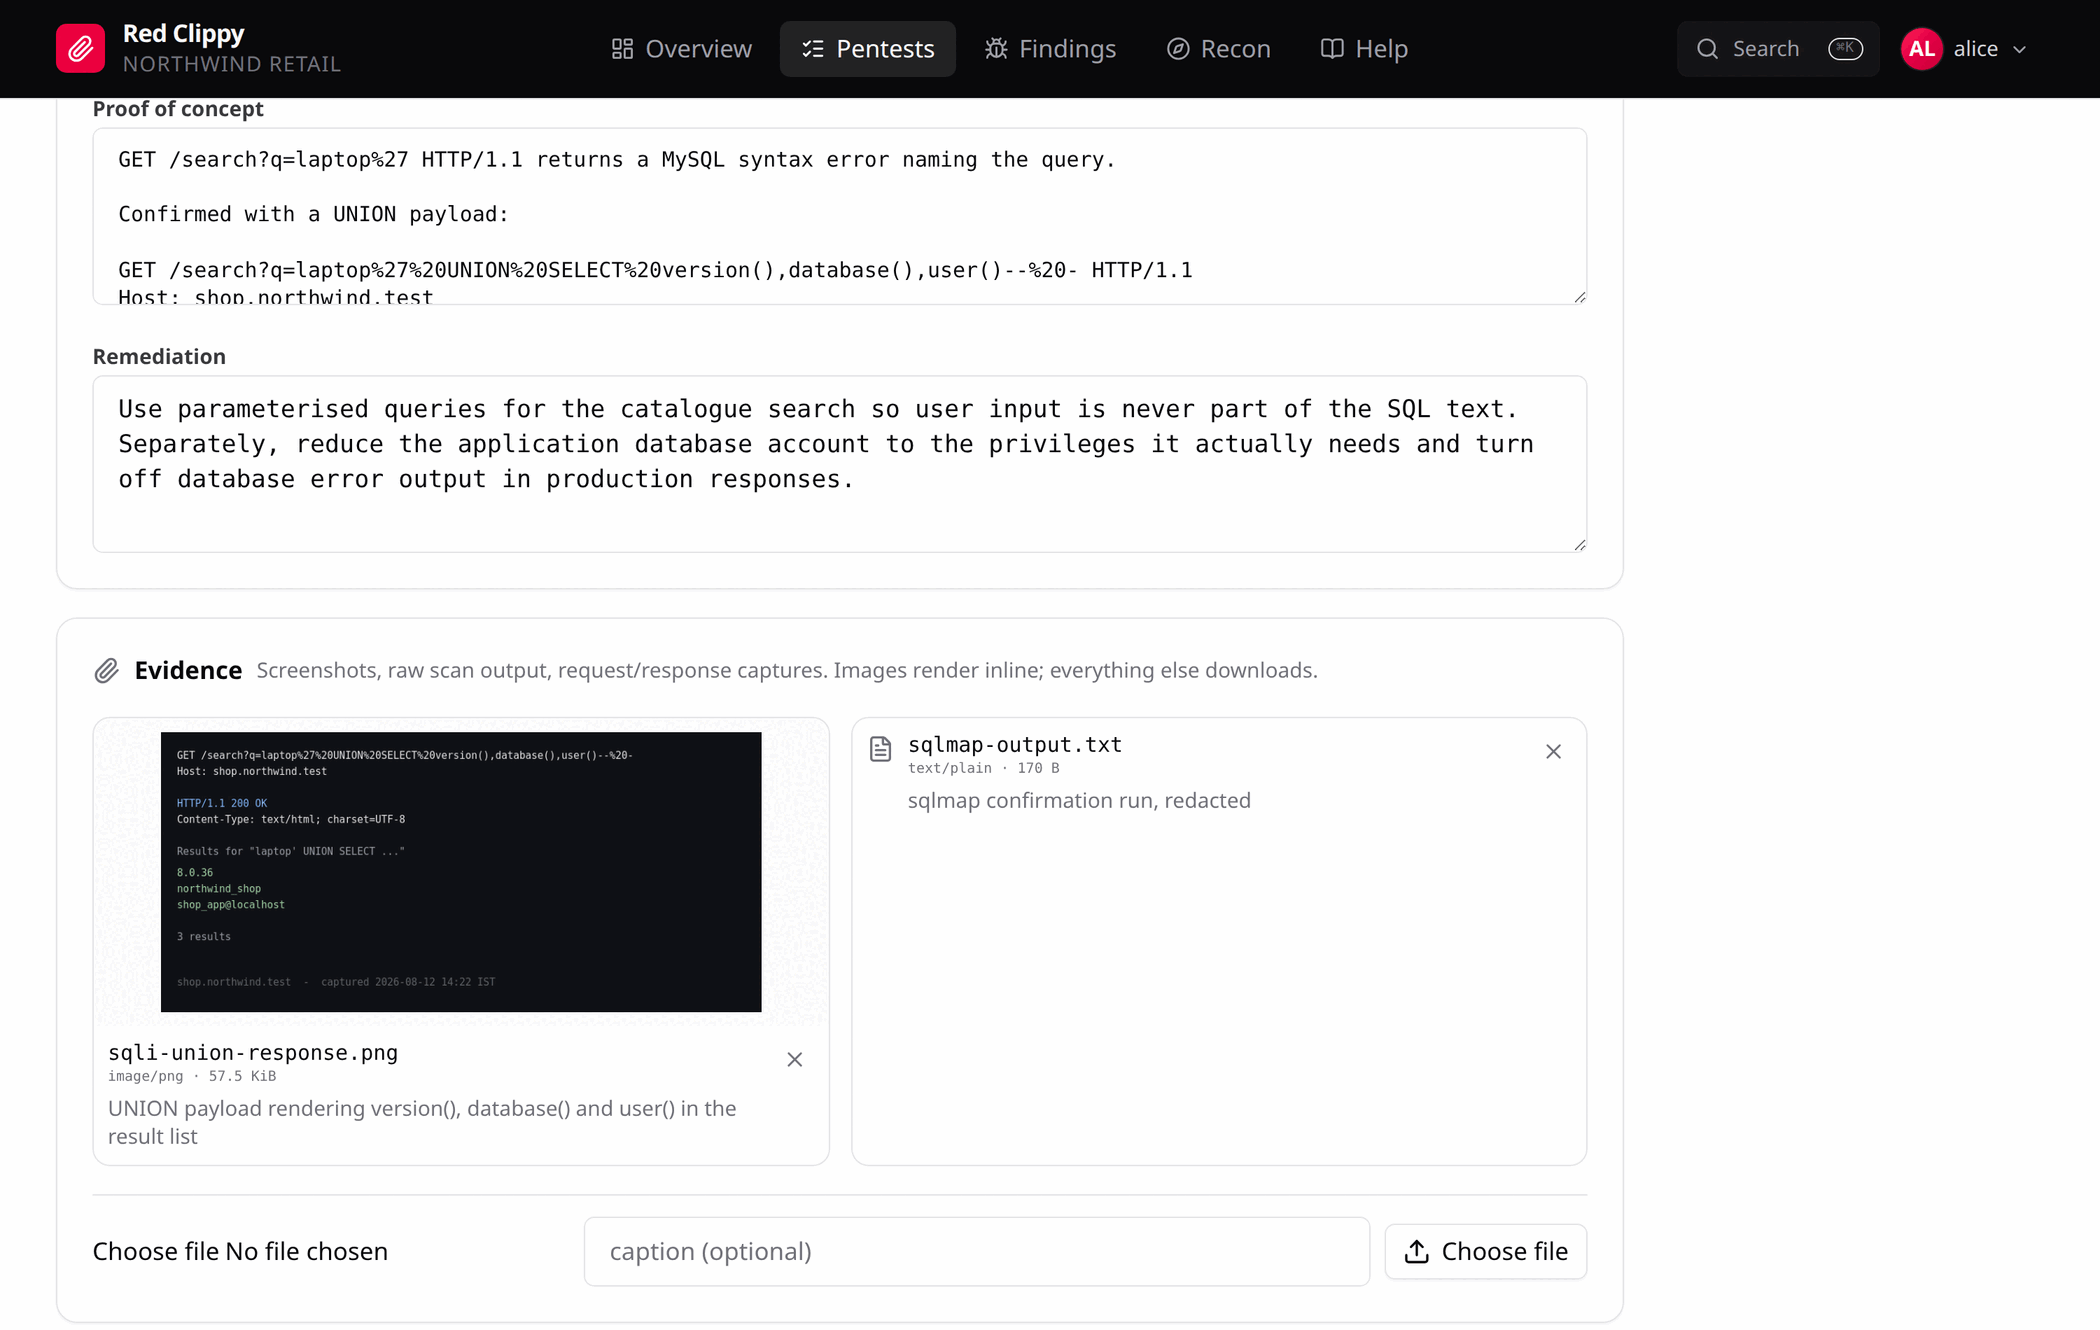
Below the body are the files attached to this finding. Images render inline and open full size in a new tab. Everything else shows as a file row and downloads.
Pick a file, optionally add a caption, and upload. The default size limit is
25 MiB per file, configurable with max_upload_bytes.
Evidence files are stored under the engagement’s directory with server-generated names, so the original filename never touches disk. See Files on disk.
Exporting findings
Two Excel exports, both plain .xlsx:
- Export Excel on an engagement’s findings list exports that engagement, honouring the current search, severity and status filters
- Export Excel on the cross-engagement Findings page exports everything in the organization, with two extra leading columns for the pentest code and name
Columns are ID, Title, Severity, Status, CVSS Score, CVSS Vector, CWE, CVE, URL, Affected Asset, Tags, Details, Impact, PoC, Remediation, Created, Updated.
Deleting a finding
Delete on the finding form removes it after a confirmation. Deleting an asset does not delete findings tagged against it, so an over-enthusiastic scope cleanup cannot take your report with it.
Searching across engagements
Three pages work across the whole organization rather than one engagement: Findings, Recon, and Search. The panel labels the first two Library, which is what the eyebrow above the heading says on each.
Findings across engagements
Findings in the top bar is every finding the organization has ever logged.
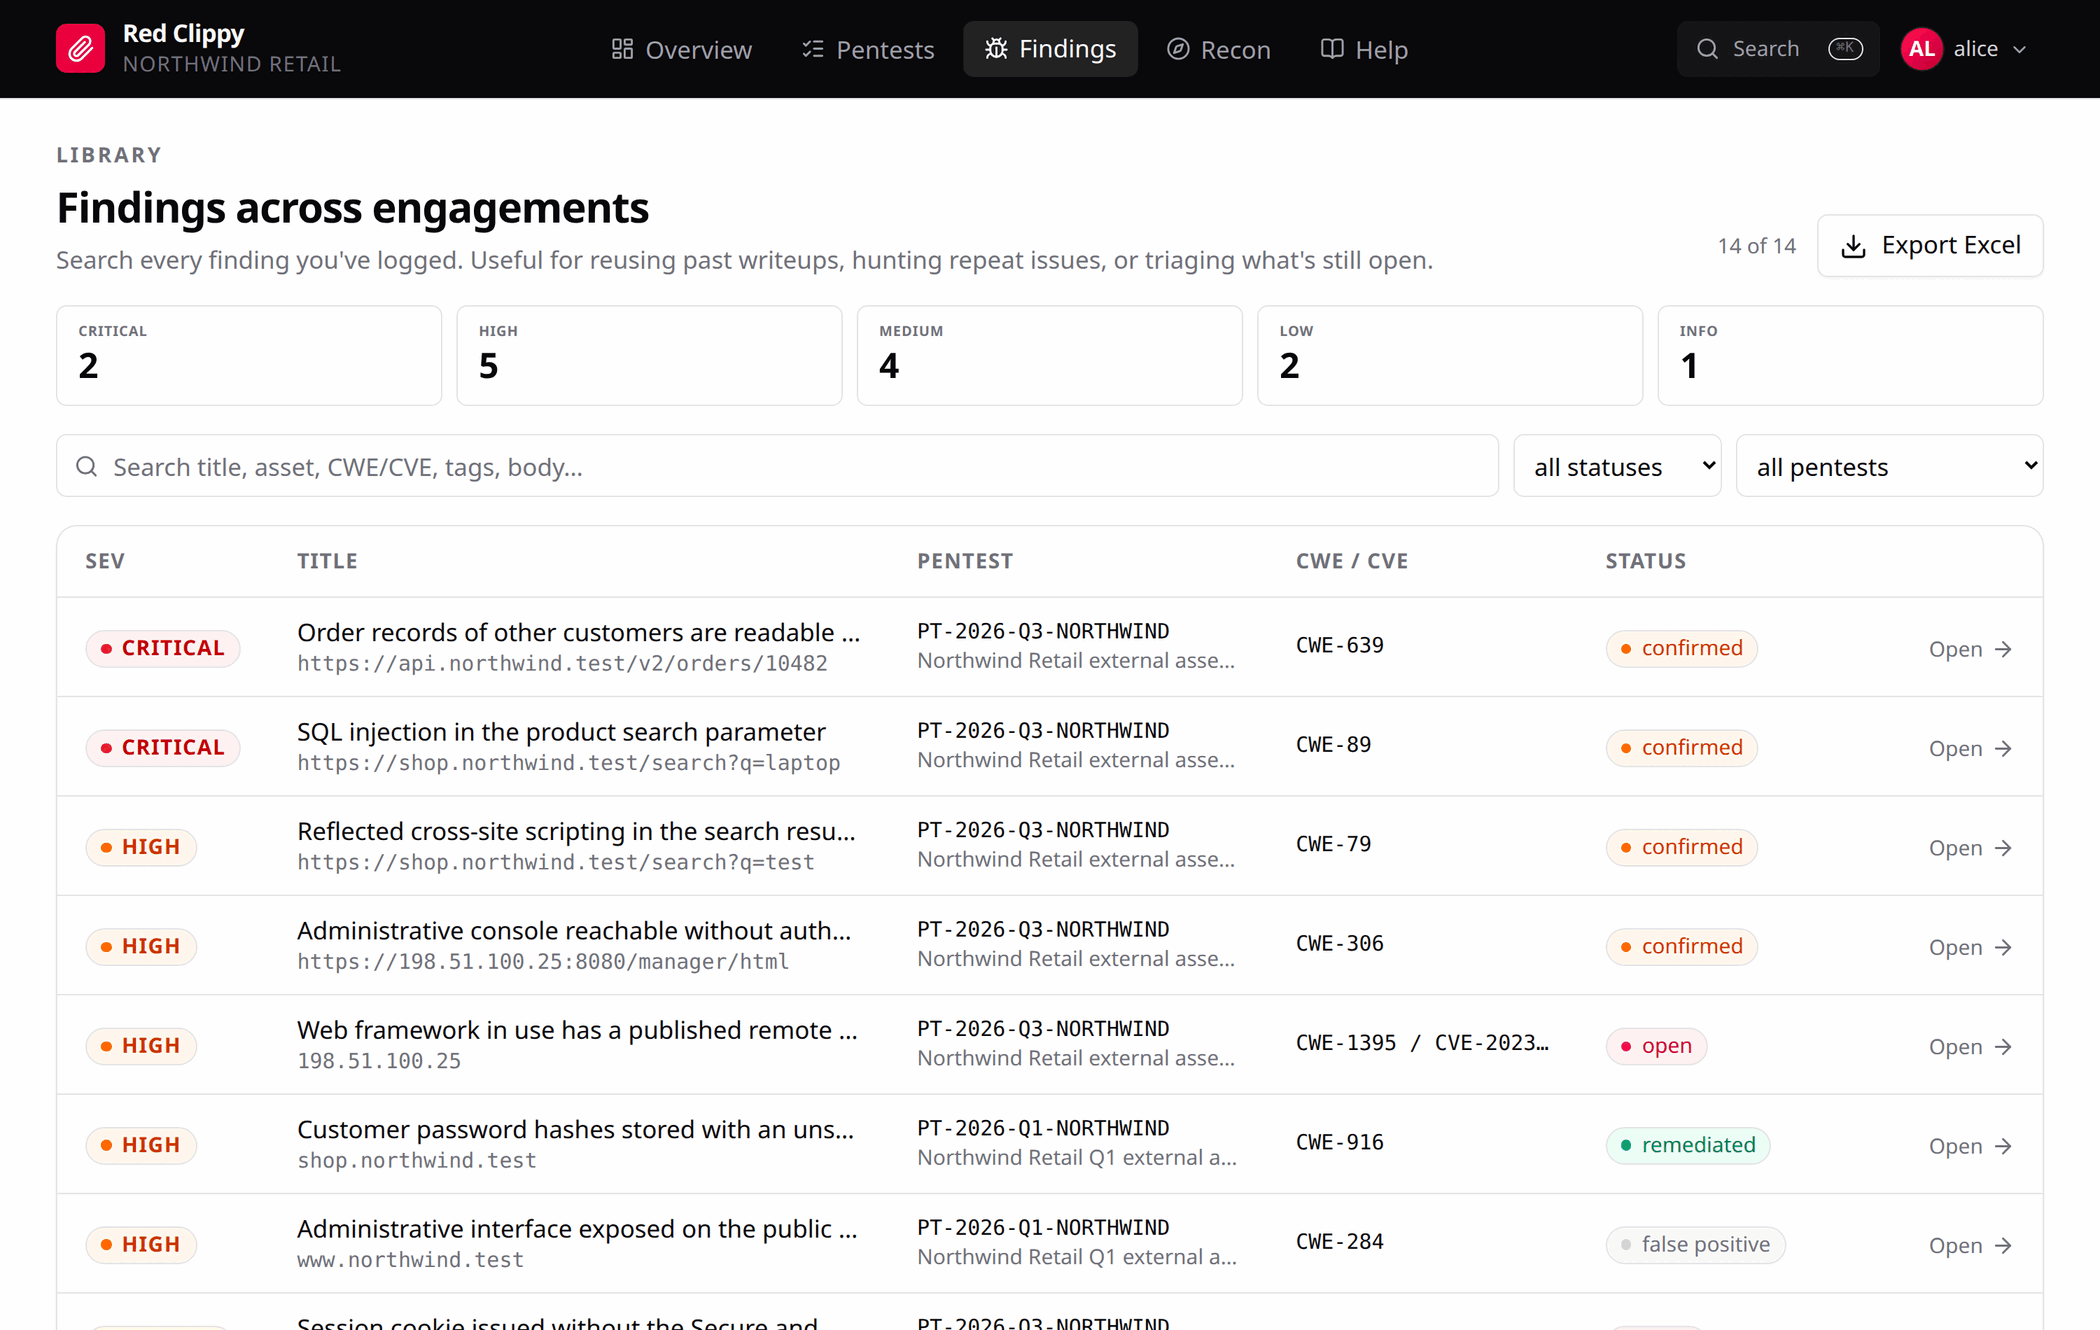
Five severity tiles across the top double as filters: click one to narrow to it, click it again to clear. Below them are a search box that matches everything (title, asset, CWE, CVE, tags, and the details, impact, proof of concept and remediation bodies), a status filter, and a filter for one engagement.
The counter next to the search box always reads “n of m”, so you can tell an over-narrow filter from an empty database at a glance.
The page has three main uses:
- Retest. Filter to last quarter’s engagement and work down the list.
- Reuse. You have written this issue up before. Find that writeup rather than writing it again.
- Repeat issues. The same missing header across four clients is worth raising differently from the same missing header once.
Export Excel downloads the whole organization’s findings, with the pentest code and name as the first two columns.
Filtering here is done in the browser over one fetch, which keeps it instant. The page is a knowledge base rather than a feed, so it is not paginated.
Recon across engagements
Recon in the top bar is the same idea for assets.
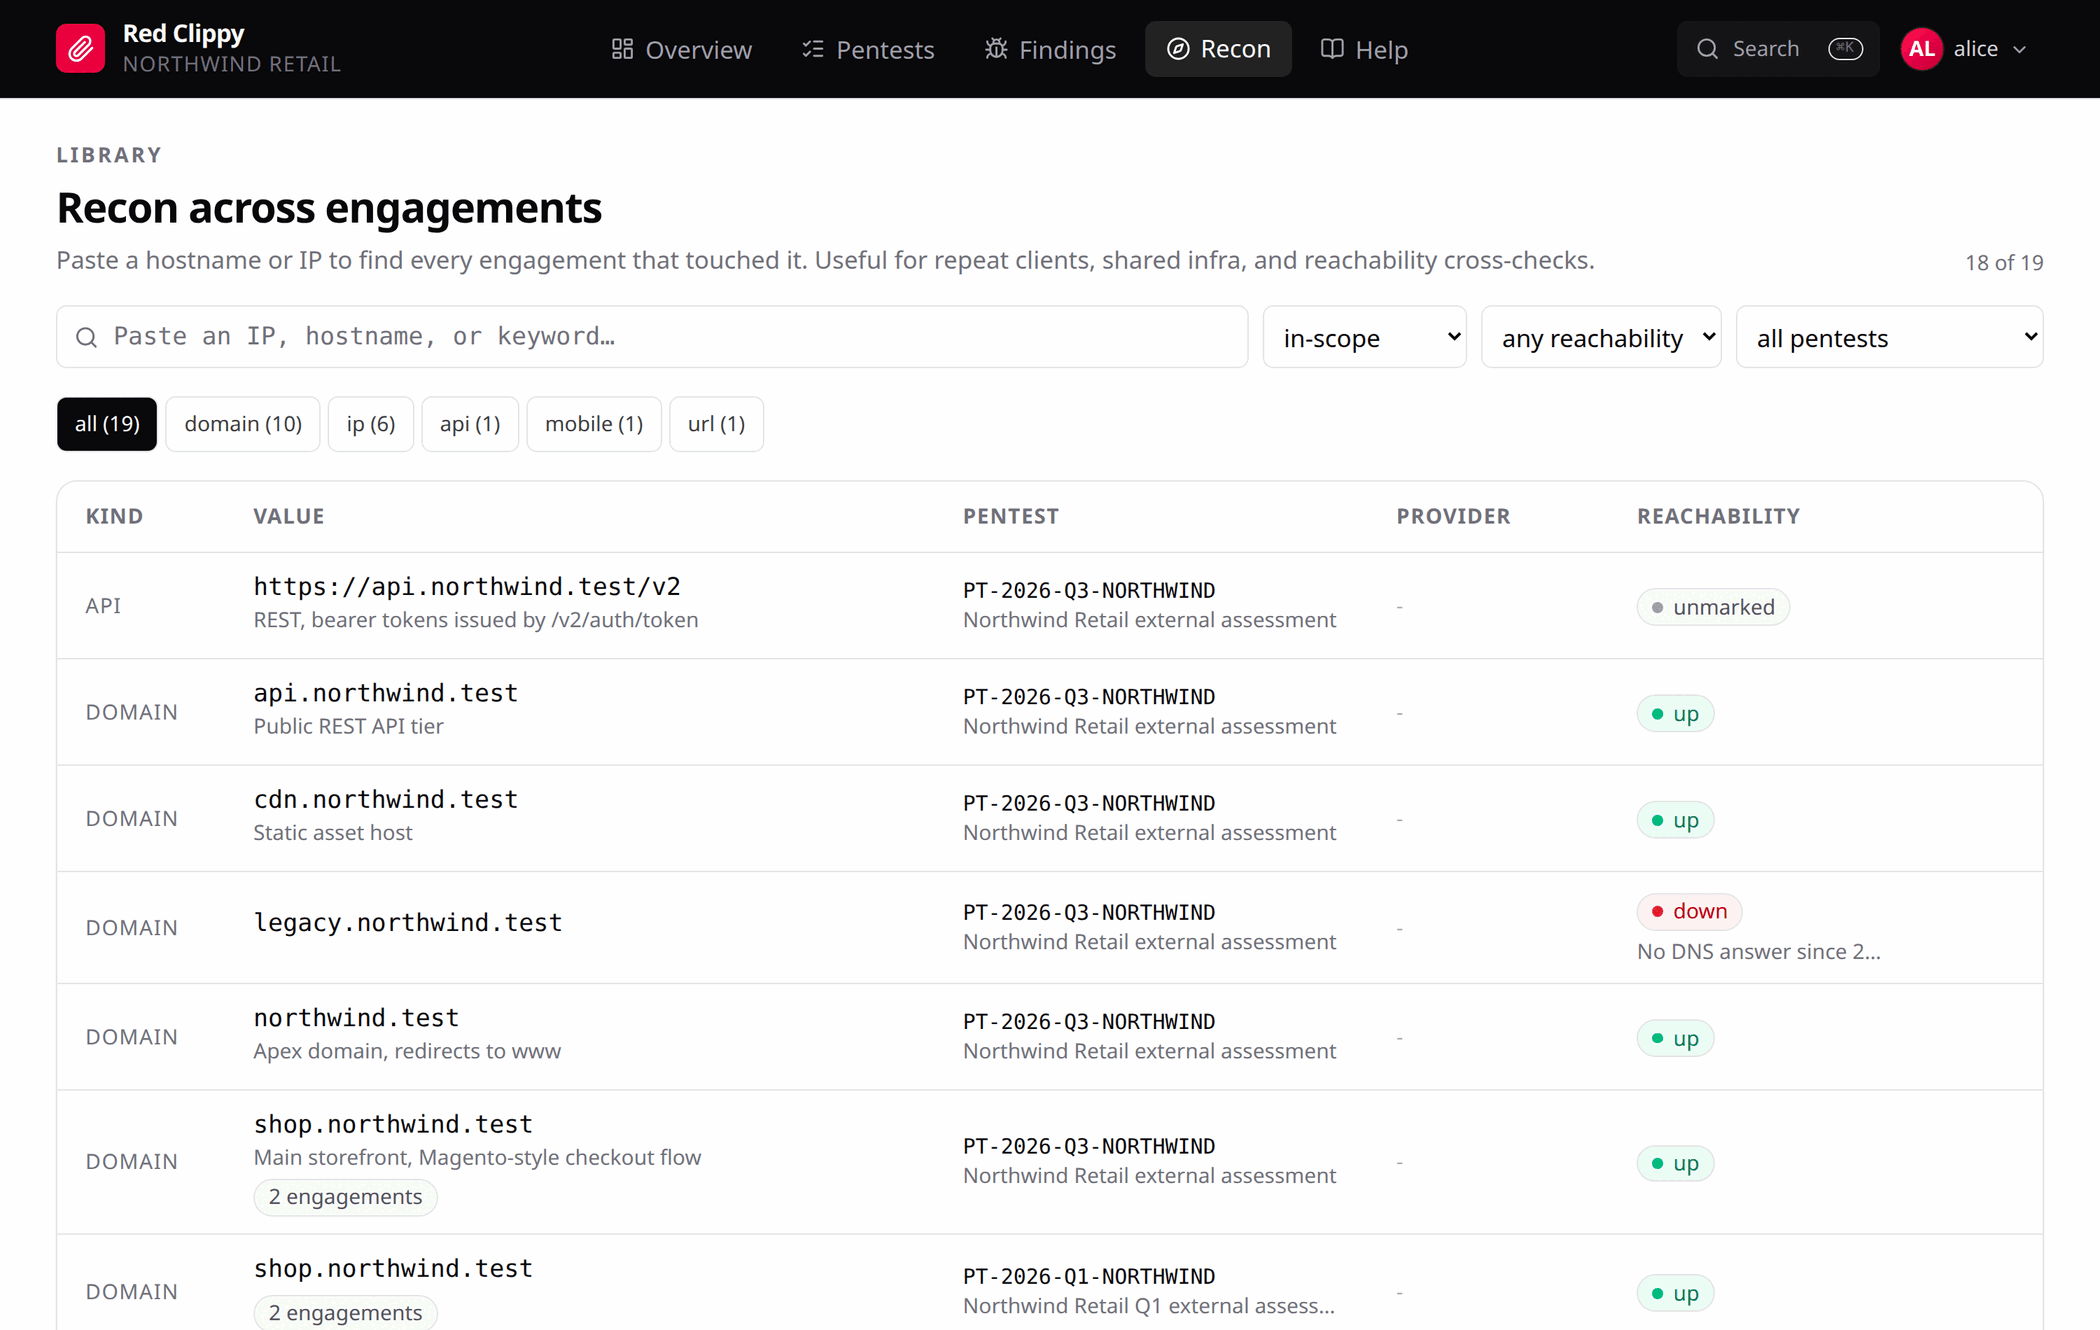
The main use is the “have I touched this before” lookup: paste a hostname or an IP and see every engagement that already has it. When the same value appears in more than one engagement, the row gets an “n engagements” badge. That usually means a repeat client or shared infrastructure.
The filters are in-scope, out-of-scope or both; reachability (up, down, blocked, unmarked); one engagement; and chips per asset kind with counts.
Watch the reachability column across engagements. The same host blocked in one and up in another is nearly always a difference in source address or VPN, not a change at the target.
Clicking a value opens that asset in its own engagement’s workspace.
Search
The command palette (Ctrl+K) covers most lookups. See all results, or
/search?q=..., opens the full page.
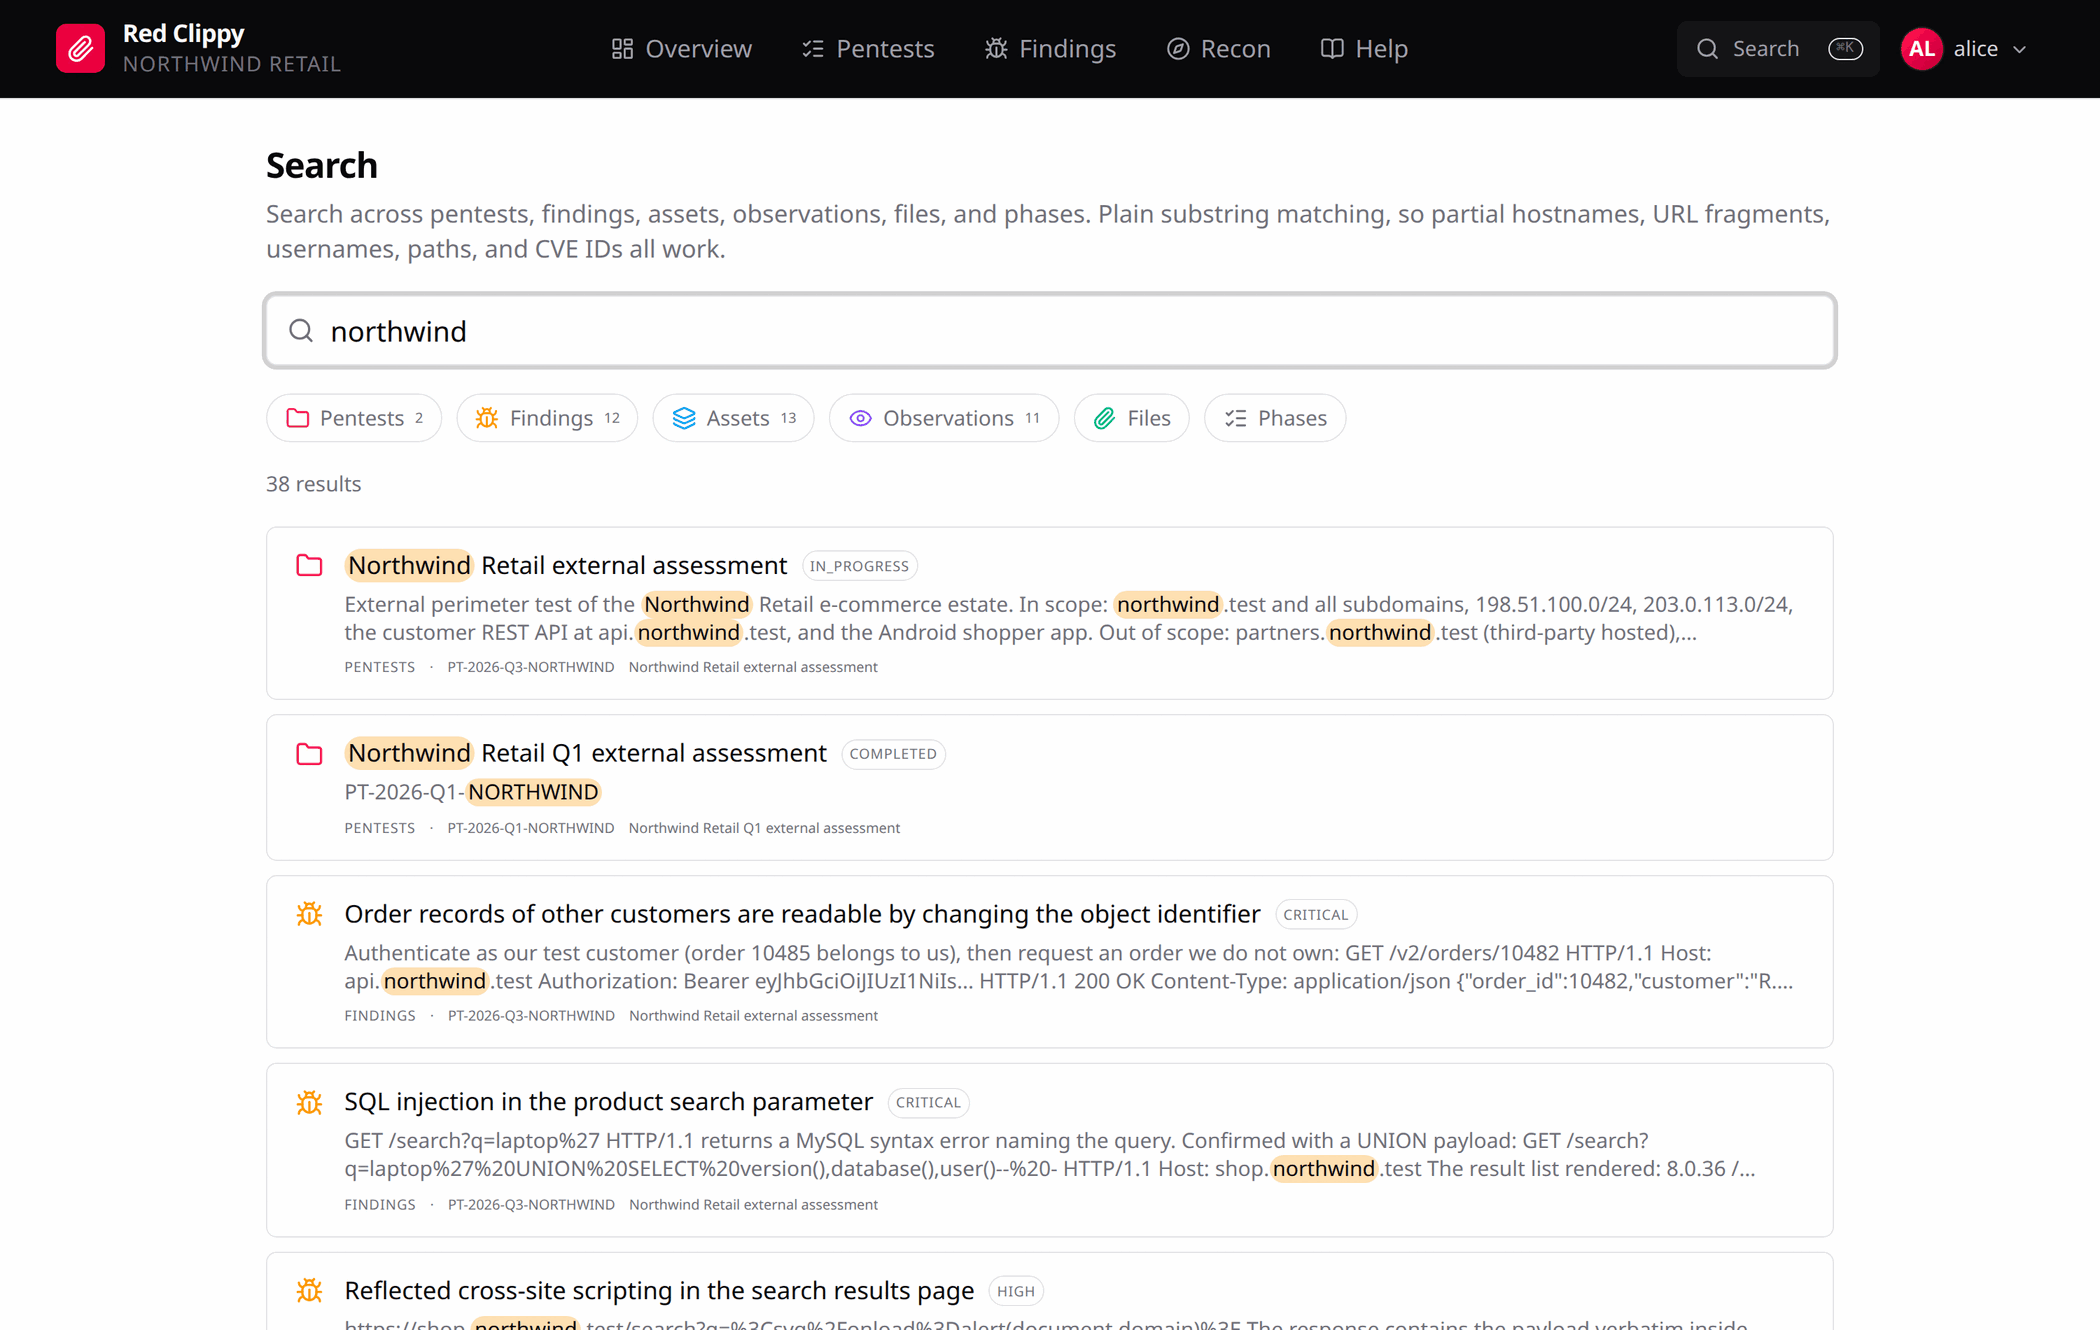
It covers pentests, findings, assets, observations, files and phases, with a count per source across the top and matches highlighted in context. Matching is plain substring, so partial hostnames, URL fragments, usernames, paths and CVE identifiers all work, and you do not have to think about tokenisation.
Every result says which engagement it came from, so a hostname that appears in three of them stays distinguishable.
Files and notes
Files
Every engagement has a file area, and so does every asset. Both use the same browser and the same storage, showing a different slice of the tree.
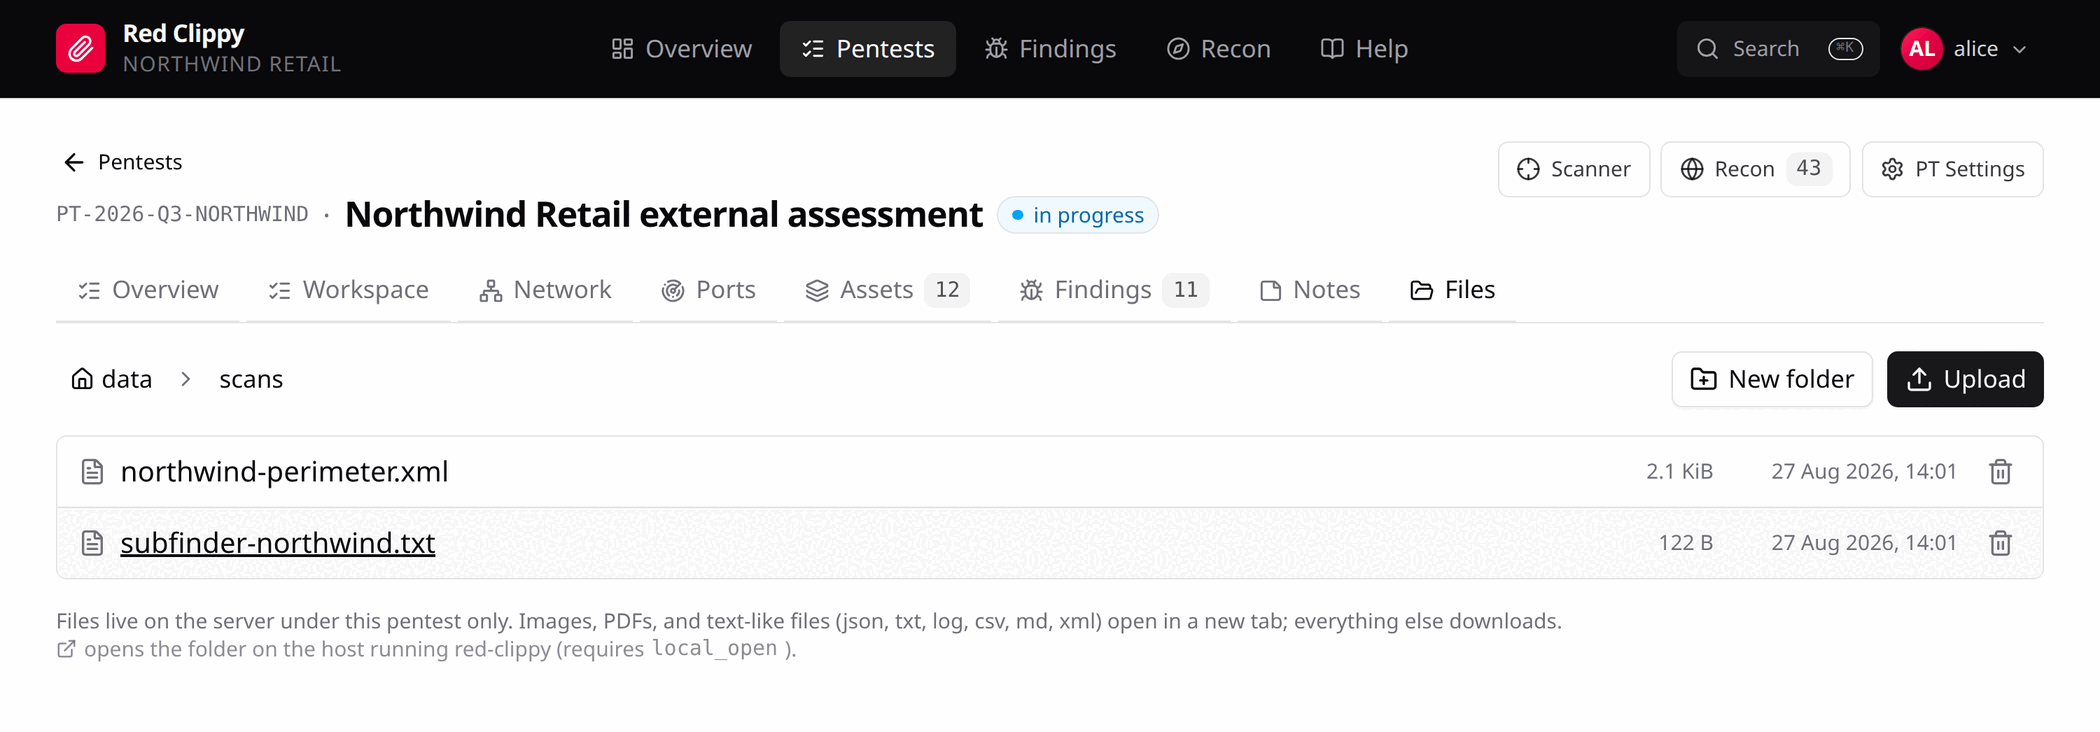
The breadcrumb at the top navigates back up. New folder creates a subfolder, Upload adds files to the folder you are in, and the bin icon on a row deletes.
Images, PDFs and text-like files (json, txt, log, csv, md, xml)
open in a new tab. Everything else downloads.
This is the right place for raw scan output, screenshots that are not attached to a specific finding, client-supplied documents, and any working file you want to survive the session. See Files on disk for where they end up on the server.
Reveal in file manager
The external-link icon asks the server to open the folder in the desktop file
manager of the machine running red-clippy serve. It is off unless
local_open = true is set in the config file.
Turn it on only when the server is your own desktop in a logged-in graphical session. Under systemd, or on a machine you are reaching over the network, there is no session for it to open into and it will either fail or do something you did not intend.
Agents and files
The asset file area is reachable over MCP with list_asset_files,
read_asset_file, write_asset_file, create_asset_folder and
delete_asset_file. An agent can therefore keep its working notes and its raw
output in the same place you would, and you can read them in the browser
without asking it for a summary.
Notes
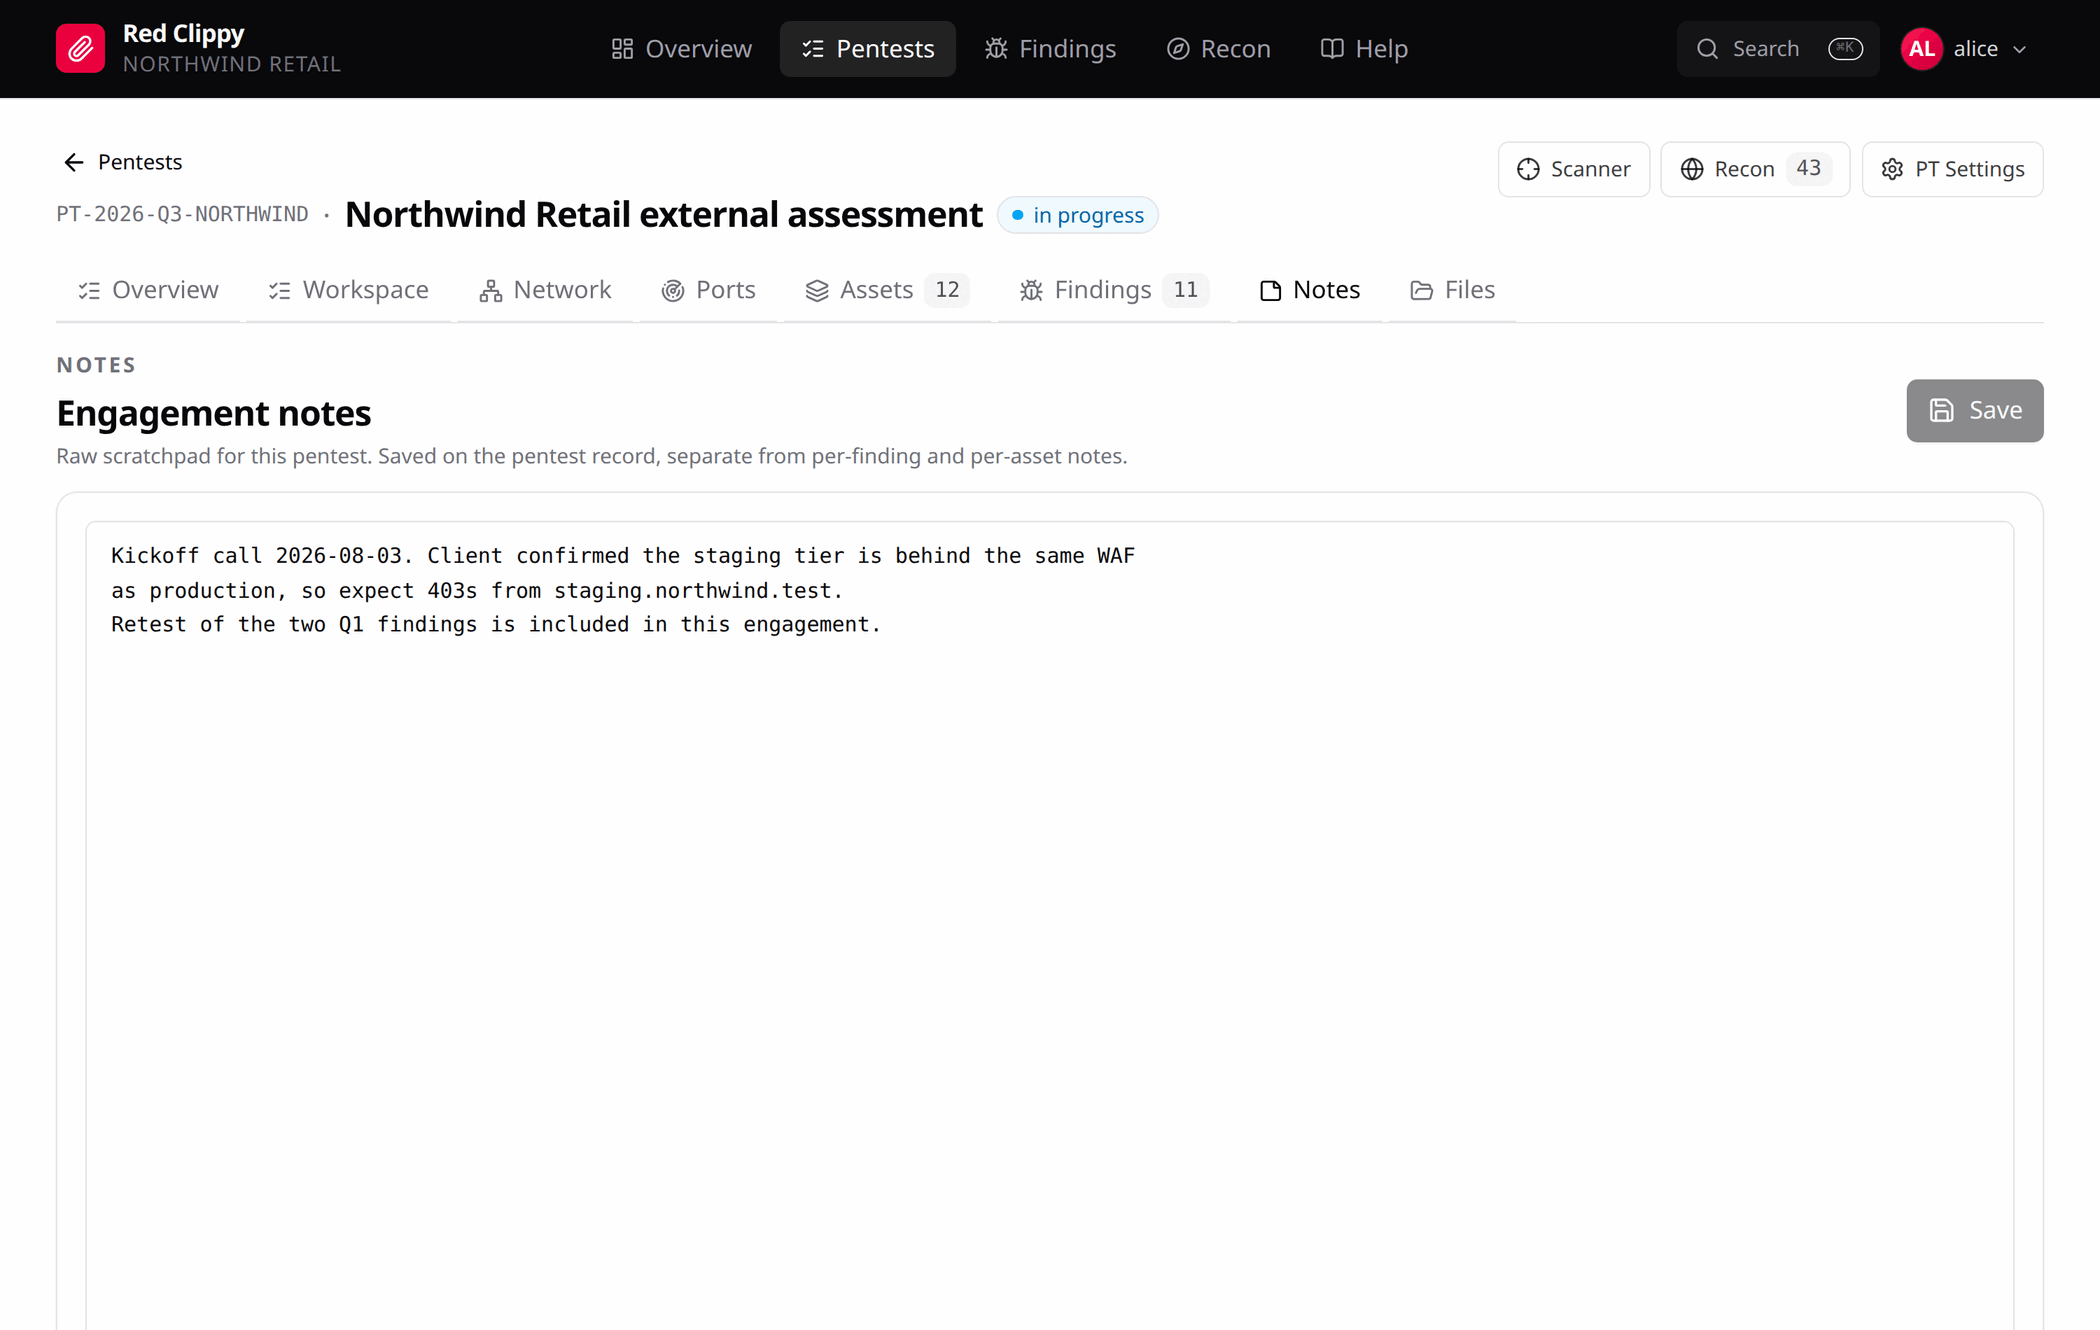
The Notes tab is a full-page scratchpad for the engagement. Commands tried, payloads to revisit, half-formed observations, the thing the client said on the phone. Markdown, code blocks, or nothing in particular.
Ctrl+S saves, or use the Save button. The header says “unsaved changes”
while your draft differs from what is stored, so a closed tab does not quietly
lose an hour of thinking.
There are four separate note fields in the app, and they are separate on purpose:
| Notes on | Where | Good for |
|---|---|---|
| The engagement | Notes tab, and the Notes field on PT Settings | Anything about the engagement as a whole. |
| A phase | Workspace, engagement mode | What happened during scoping, recon, testing. |
| A check | Workspace, asset methodology | Evidence, repro steps, payloads tried, responses seen. |
| An asset | Asset workspace, Notes tab | What this host is, how it behaves, what to come back to. |
The engagement Notes tab and the PT Settings notes field are the same underlying field, shown twice: once in a form with the rest of the engagement record, and once on a page with room to actually write.
Importing scanner output
Red Clippy parses the export formats of seven tools and writes the results straight into an engagement: assets, observations, findings and the raw scan record, from a single upload.
The import page
The full import page lives at /pentests/<id>/import. It is not on the tab
strip, so type the URL or use the per-asset Import tab, which appears on IP
assets and does the same thing scoped to that host.
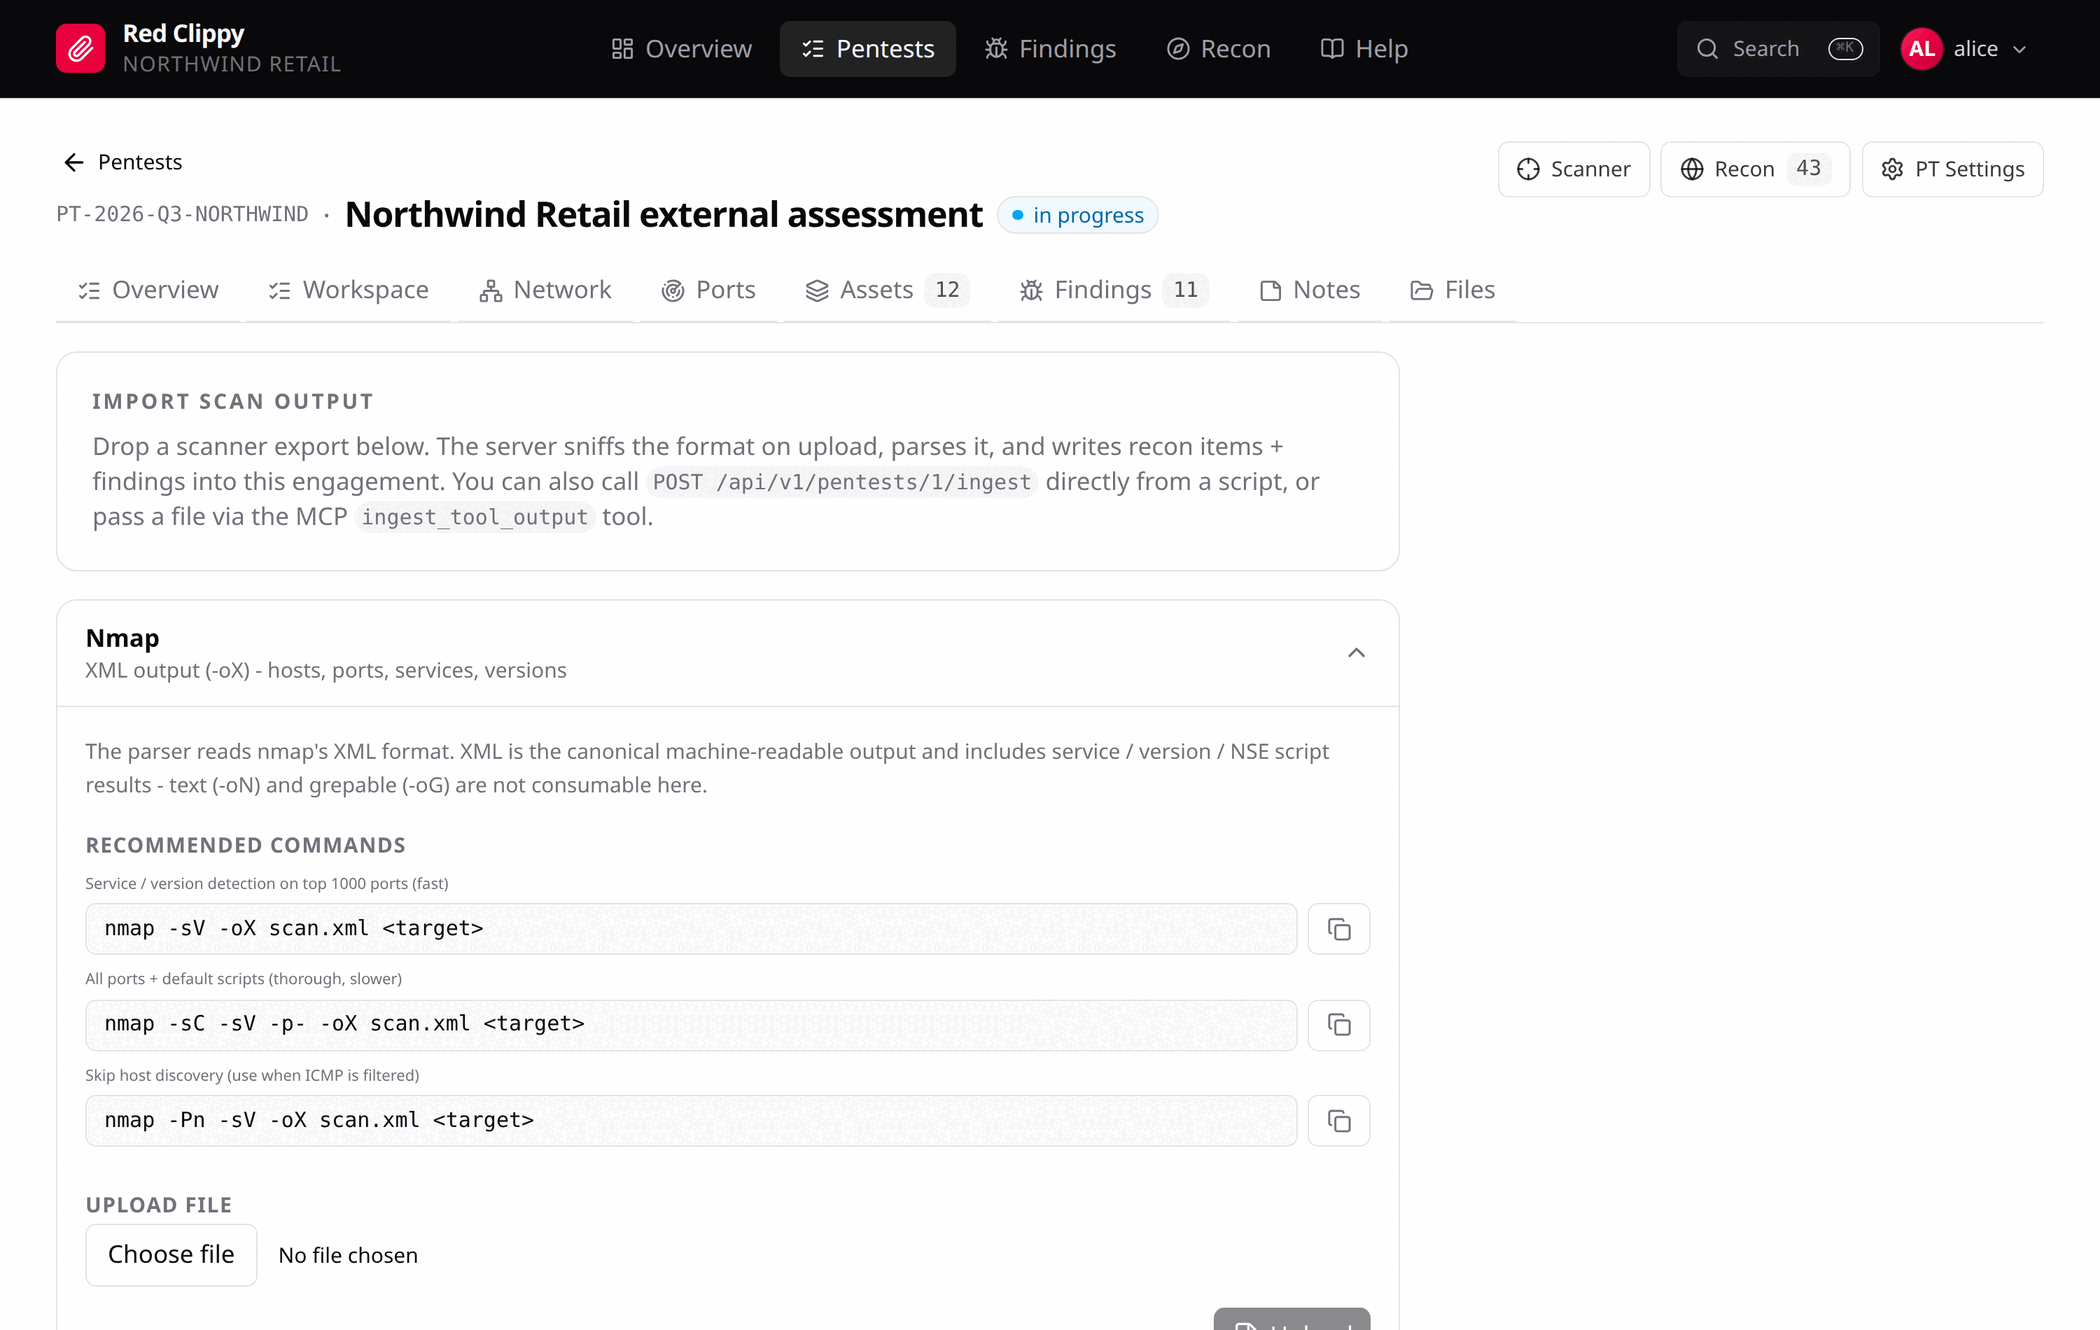
Each tool gets a card. Expanding one shows what the parser expects, the commands that produce it, and an upload box. The copy button next to a command puts it on the clipboard.
Upload a file and Red Clippy tells you exactly what it did:
Ingested nmap from perimeter.xml: 7 assets, 8 observations,
0 findings, 1 nmap scans.
The bottom of the page lists the recent nmap scans for this engagement, with the target and the command line each one was run with.
Supported formats
| Tool | Format | What you get |
|---|---|---|
| Nmap | XML (-oX) | IP assets, hostname assets from PTR records, and a port observation per open port with service, product and version. The raw scan is kept with its command line. |
| Burp Suite | Issues XML | One finding per issue, with the request and response as proof of concept, plus Burp’s background, remediation and references. |
| Nessus | .nessus v2 | One finding per report item, carrying the CVSS vector, score and CVE. Items marked informational with no CVSS score are skipped. Each host also produces host metadata and port observations. |
| OpenVAS / GVM | Report XML | Findings from host-bound NVT results, with the threat level mapped to a severity, plus host and port observations and the CVE and OID. |
| Masscan | JSON (-oJ or -oD) | IP assets and port observations. Masscan reports open ports only, never services. |
| Naabu | JSON lines | IP assets, port observations, and a domain asset when the record’s host differs from its ip. |
| Subfinder | One host per line (-silent) | A domain asset per line. |
The format is detected from the content on upload, so you do not have to say which tool produced a file. Subfinder is the exception: a bare list of hostnames is too generic to auto-detect without hijacking other uploads, so it is only parsed when the format is named explicitly. The scan engine always does that; a manual upload should use the Subfinder card.
Nmap output formats
Use the XML output. It is the canonical machine-readable format and it carries
service, version and NSE script results. Normal output (-oN) and grepable
output (-oG) are not consumable.
nmap -sV -oX scan.xml <target>            # service and version detection, top 1000 ports
nmap -sC -sV -p- -oX scan.xml <target>    # all ports plus default scripts
nmap -Pn -sV -oX scan.xml <target>        # skip host discovery, for filtered ICMP
Port merging
Re-importing the same host after a service scan updates the existing port rows with the new detail instead of stacking a second copy. Ports are matched on host, port and protocol.
This is why the masscan-then-nmap pattern works: sweep wide for open ports, re-scan the interesting ones for services, and the two results fold together.
Other import paths
The same parser is reachable two other ways.
From a script, post to the ingest endpoint:
curl -X POST http://127.0.0.1:7337/api/v1/pentests/1/ingest \
  -H "Authorization: Bearer rcl_xxxx_yyyy" \
  -H "Content-Type: application/json" \
  -d "{\"format\":\"nmap\",\"filename\":\"scan.xml\",
       \"content_base64\":\"$(base64 -w0 scan.xml)\"}"
format is optional. Omit it and the server detects the format itself.
From an agent, the ingest_tool_output MCP tool takes the same payload.
This is the main way results move out of an agent’s shell and into the record,
and it is a single call regardless of how much the scan found. See
Running an engagement with an agent.
Ports and the scan engine
Two related pages. Ports shows what is open. Scanner is an optional built-in runner for going and finding out.
Ports
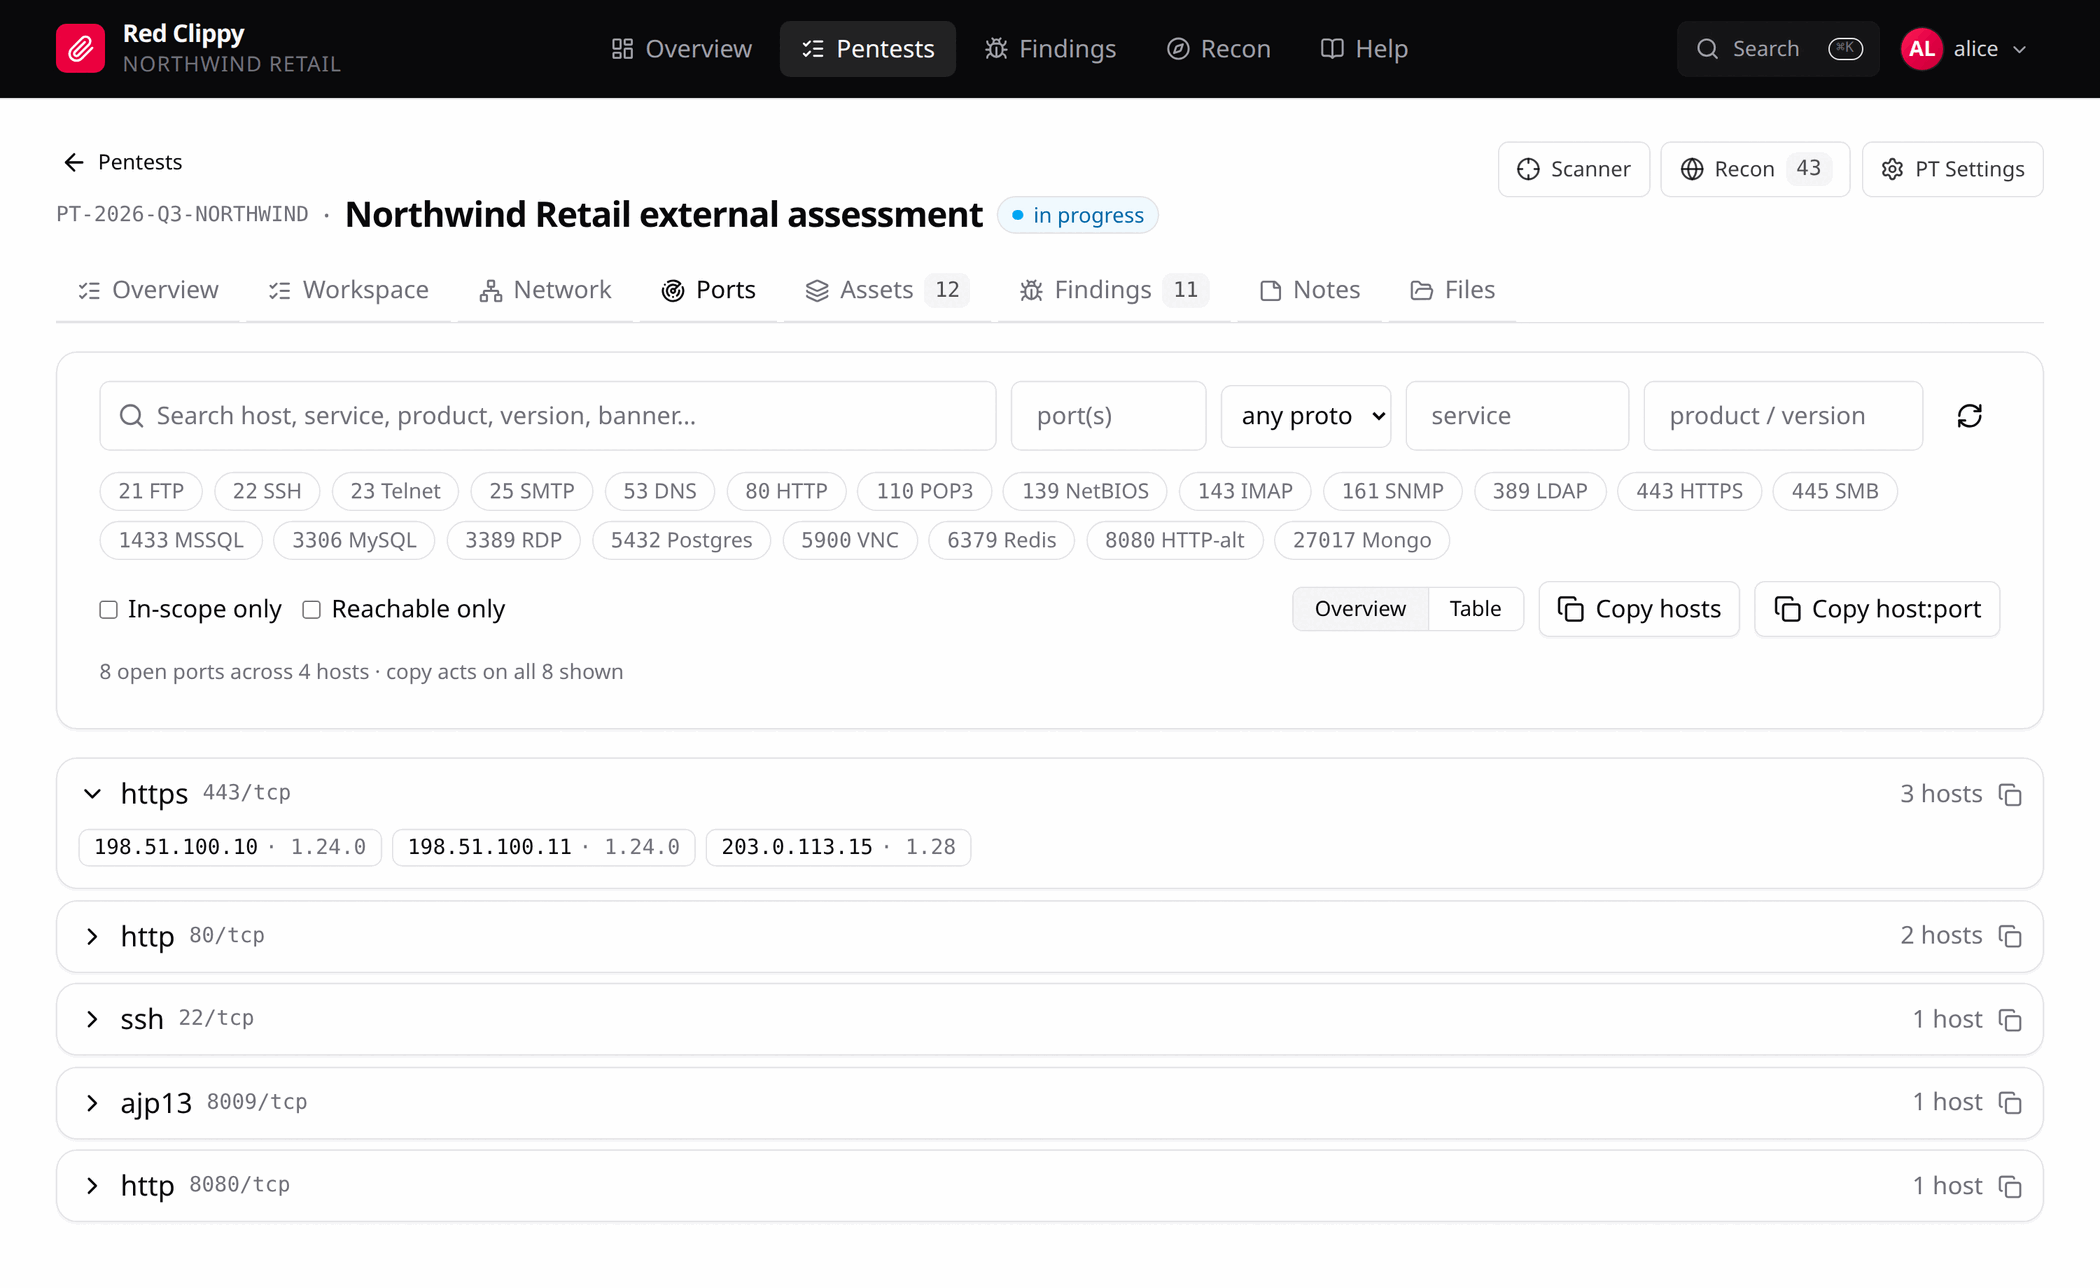
This page lists every open port in the engagement, taken from port
observations. Those arrive from a scanner import, from the built-in scan engine,
or from typing them in on an asset’s Ports tab. It does not matter which; they
all land in the same place.
The filter row narrows by free text (host, service, product, version, banner), by port number or range, by protocol, by service name and by product or version. The chips below are shortcuts for the ports you ask about most: 21 FTP, 22 SSH, 23 Telnet, 25 SMTP, 53 DNS, 80 HTTP, 110 POP3, 139 NetBIOS, 143 IMAP, 161 SNMP, 389 LDAP, 443 HTTPS, 445 SMB, 1433 MSSQL, 3306 MySQL, 3389 RDP, 5432 Postgres, 5900 VNC, 6379 Redis, 8080 HTTP-alt, 27017 Mongo.
In-scope only and Reachable only hide everything you have already excluded or marked as down.
Overview groups by service and port, with a host count on each; expanding a group lists the hosts. Table is one row per host and port, which is the view to use before copying the results somewhere else.
Copy hosts and Copy host:port put the current filtered set on the clipboard, in the format your next tool wants. The line under the filters spells out what that set currently is: “8 open ports across 4 hosts, copy acts on all 8 shown”. Check it before you copy, or you may take a filtered view for the whole list.
The scan engine
The Scanner button in the engagement header opens the built-in runner.
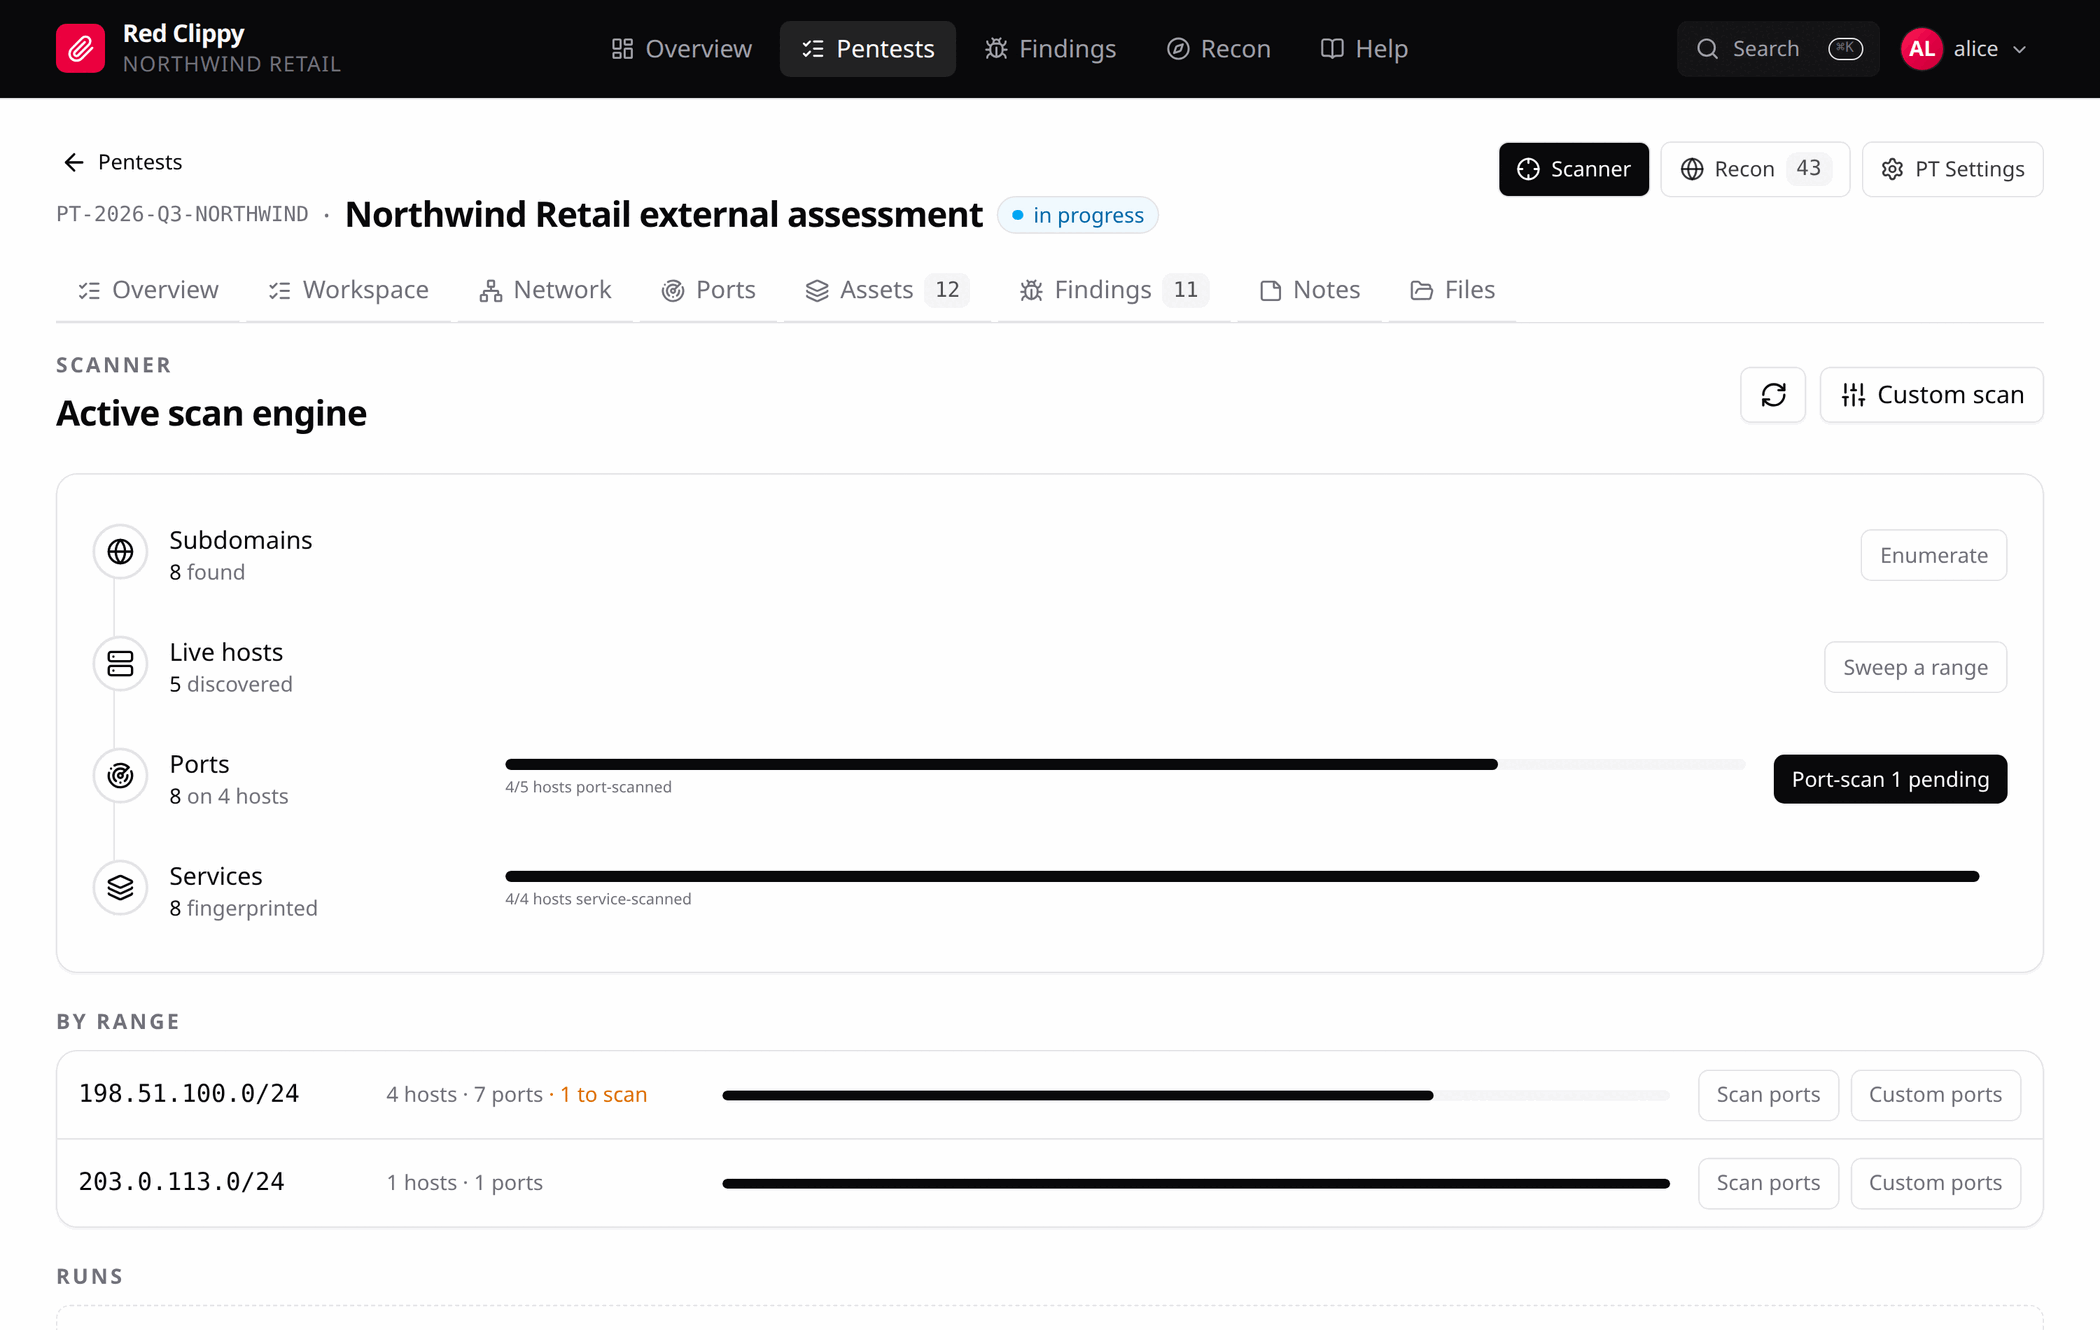
The scan engine is a convenience for working by hand. It shells out to tools
installed on the machine running red-clippy serve and ingests their output
through the same parsers as a manual import. It is not part of the agent-driven
workflow, where the agent runs its own tooling and posts the results back.
The funnel
Four stages, in order:
| Stage | Tool | What it does |
|---|---|---|
| Subdomains | subfinder | Passive subdomain enumeration for a domain. |
| Live hosts | nmap host sweep | Host discovery across a range. Probes ICMP plus common TCP and UDP ports including 135, 139, 445 and 3389, so it finds Windows hosts that block ping and serve nothing on 80 or 443. Works unprivileged. |
| Ports | nmap, naabu, masscan | Port scanning. Top 1000, all 65535, a custom list, naabu’s fast connect scan, or masscan’s SYN scan. |
| Services | nmap service scan | Service, version and default-script detection on hosts that already have an open port. |
Each row shows what has been found, with a progress bar for how much of the available surface that stage has covered. The button on the right launches the stage with sensible defaults. If a tool is not installed, the panel says so and gives you the install command instead of failing at run time.
masscan needs root or cap_net_raw. Everything else runs unprivileged.
Targets
A scan takes its targets from one of four sources:
| Source | Targets |
|---|---|
| Type targets | IPs, CIDRs or domains you type in. |
| In-scope ranges | Every declared in-scope range. |
| Live hosts | IP assets already discovered. |
| Open-port hosts | Hosts that already have at least one open port. |
Coverage and resumption
By range breaks coverage down per declared range: how many hosts, how many ports, and how many targets remain unscanned. Launching a scan skips targets already covered by an equivalent run, so re-running a stage after adding a range scans the new addresses only.
Scan ports and Custom ports on a range row launch that range directly.
You can also mark coverage by hand, for when you scanned something outside Red Clippy and want the funnel to stop asking for it.
Chaining
The custom scan drawer can queue follow-up stages: run host discovery, then automatically port-scan whatever came back alive, then service-scan whatever had a port open. The preview line at the bottom of the drawer spells out exactly what will run and against what before you commit to it.
Runs
Each run appears in the Runs list with its stage, status (running, done, failed, canceled), targets and results. Expand one to see per-target tasks, grouped by declared range. Running scans can be cancelled, individual tasks skipped, and finished runs cleared in bulk.
The page polls while anything is running, so results appear without a refresh.
Organizations and members
Organizations in the avatar menu is the in-app replacement for the
create-org, create-user and add-member CLI commands. Anything on this
page can also be done from the command line, and vice versa.
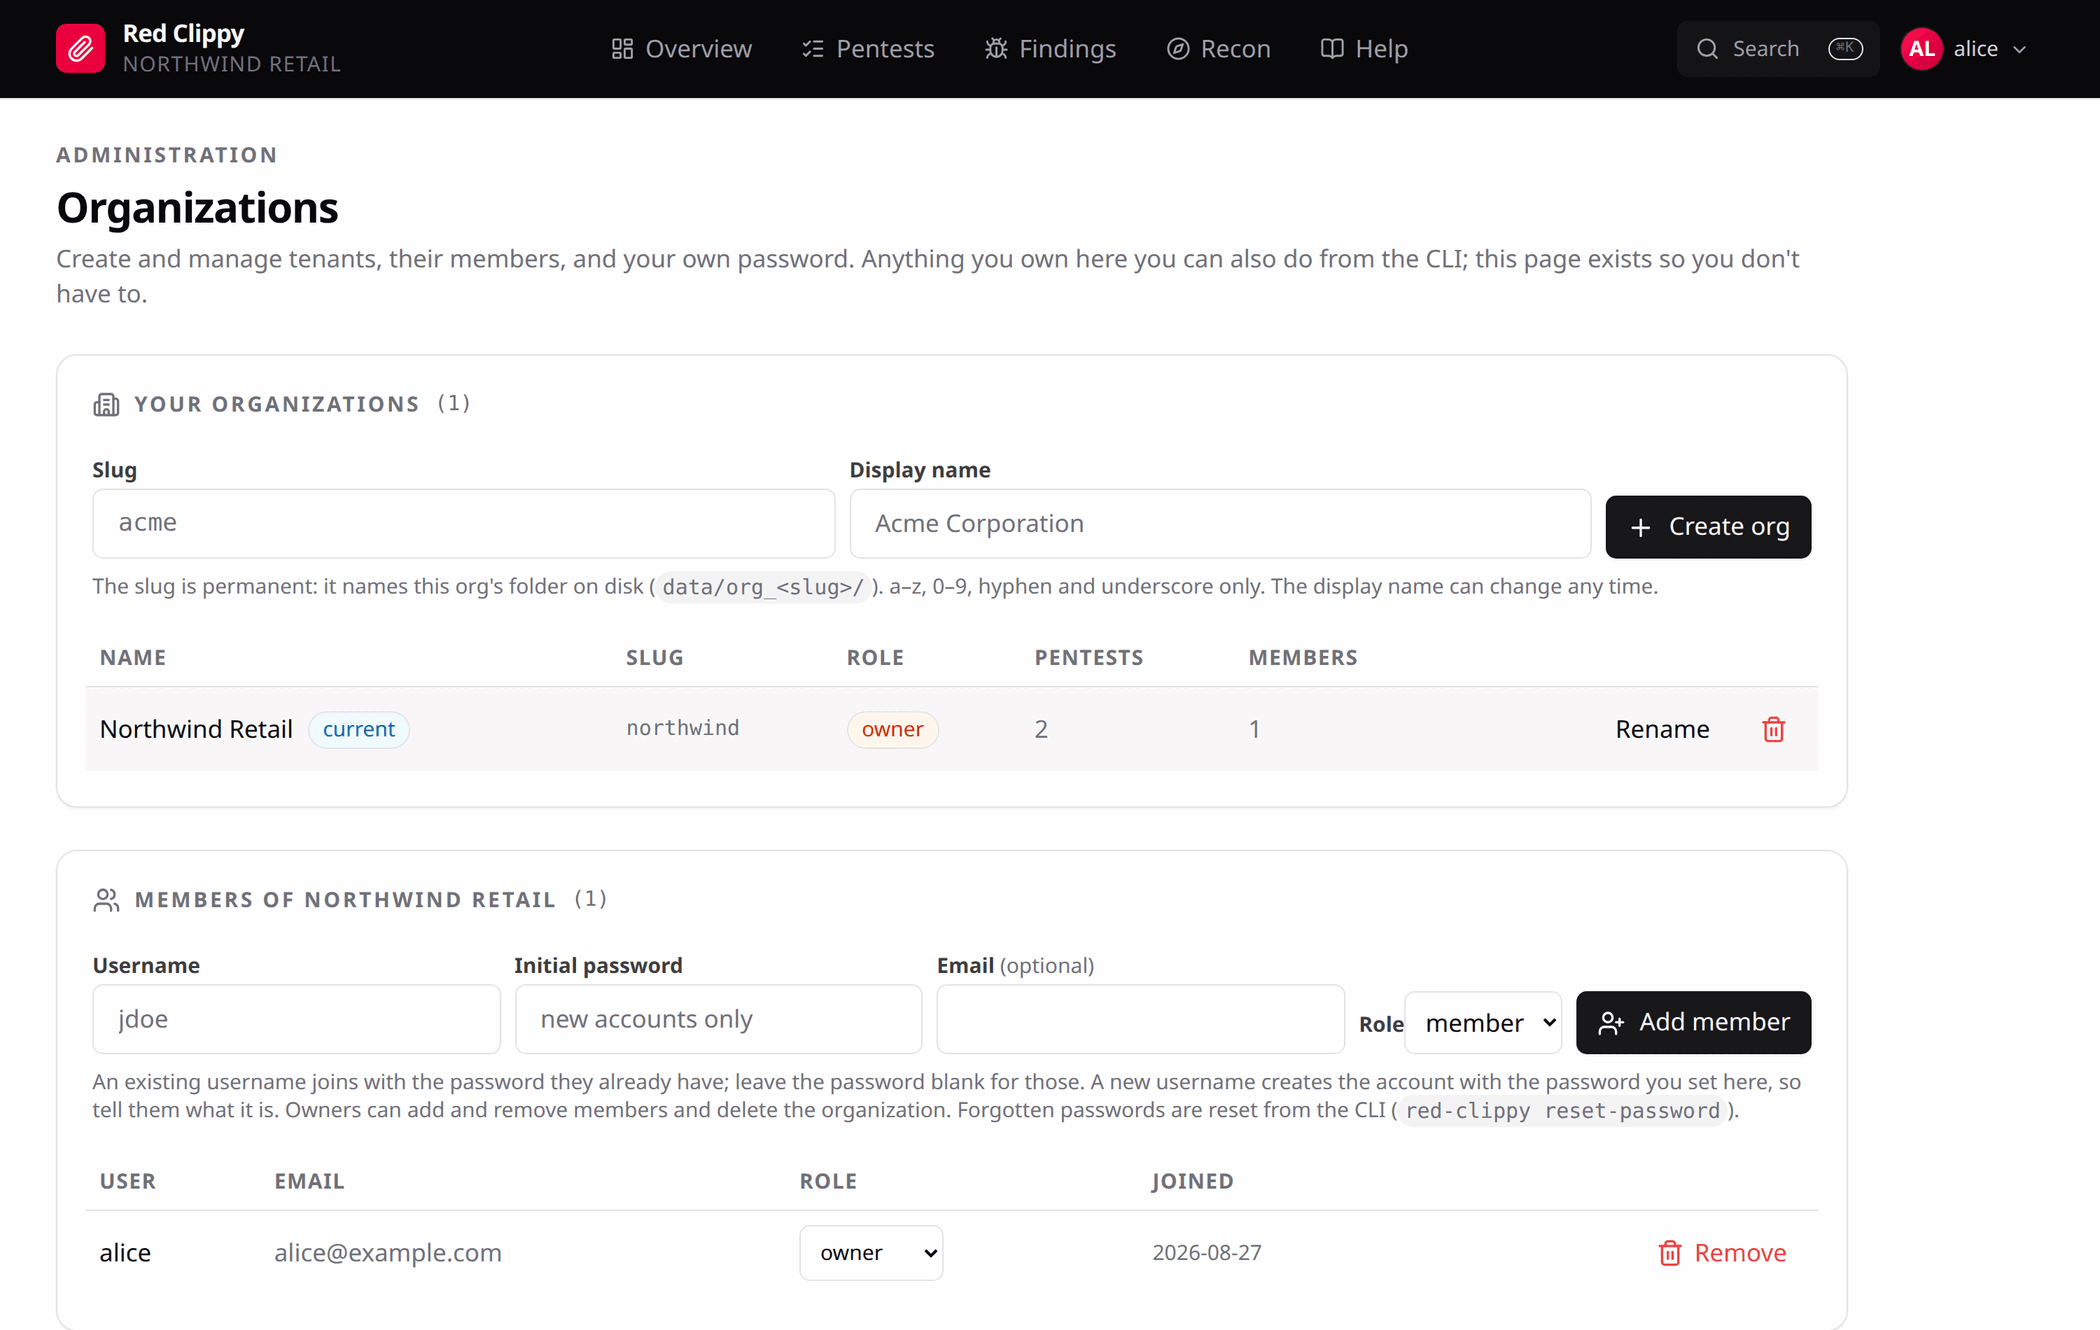
Your organizations
The table lists every organization you belong to, with your role in each, and
its pentest and member counts. The one you are currently working in is badged
current.
Switch to changes the active organization and reloads the panel. Everything cached is scoped to the previous tenant, so a full reload is the honest way to do it.
Create org takes a slug and a display name. The slug is permanent because
it names the organization’s directory on disk
(<storage_root>/org_<slug>/); use lowercase letters, digits, hyphen and
underscore. The display name can change any time with Rename.
Any signed-in user can create an organization, and becomes its owner.
Members
Selecting a row loads that organization’s members below.
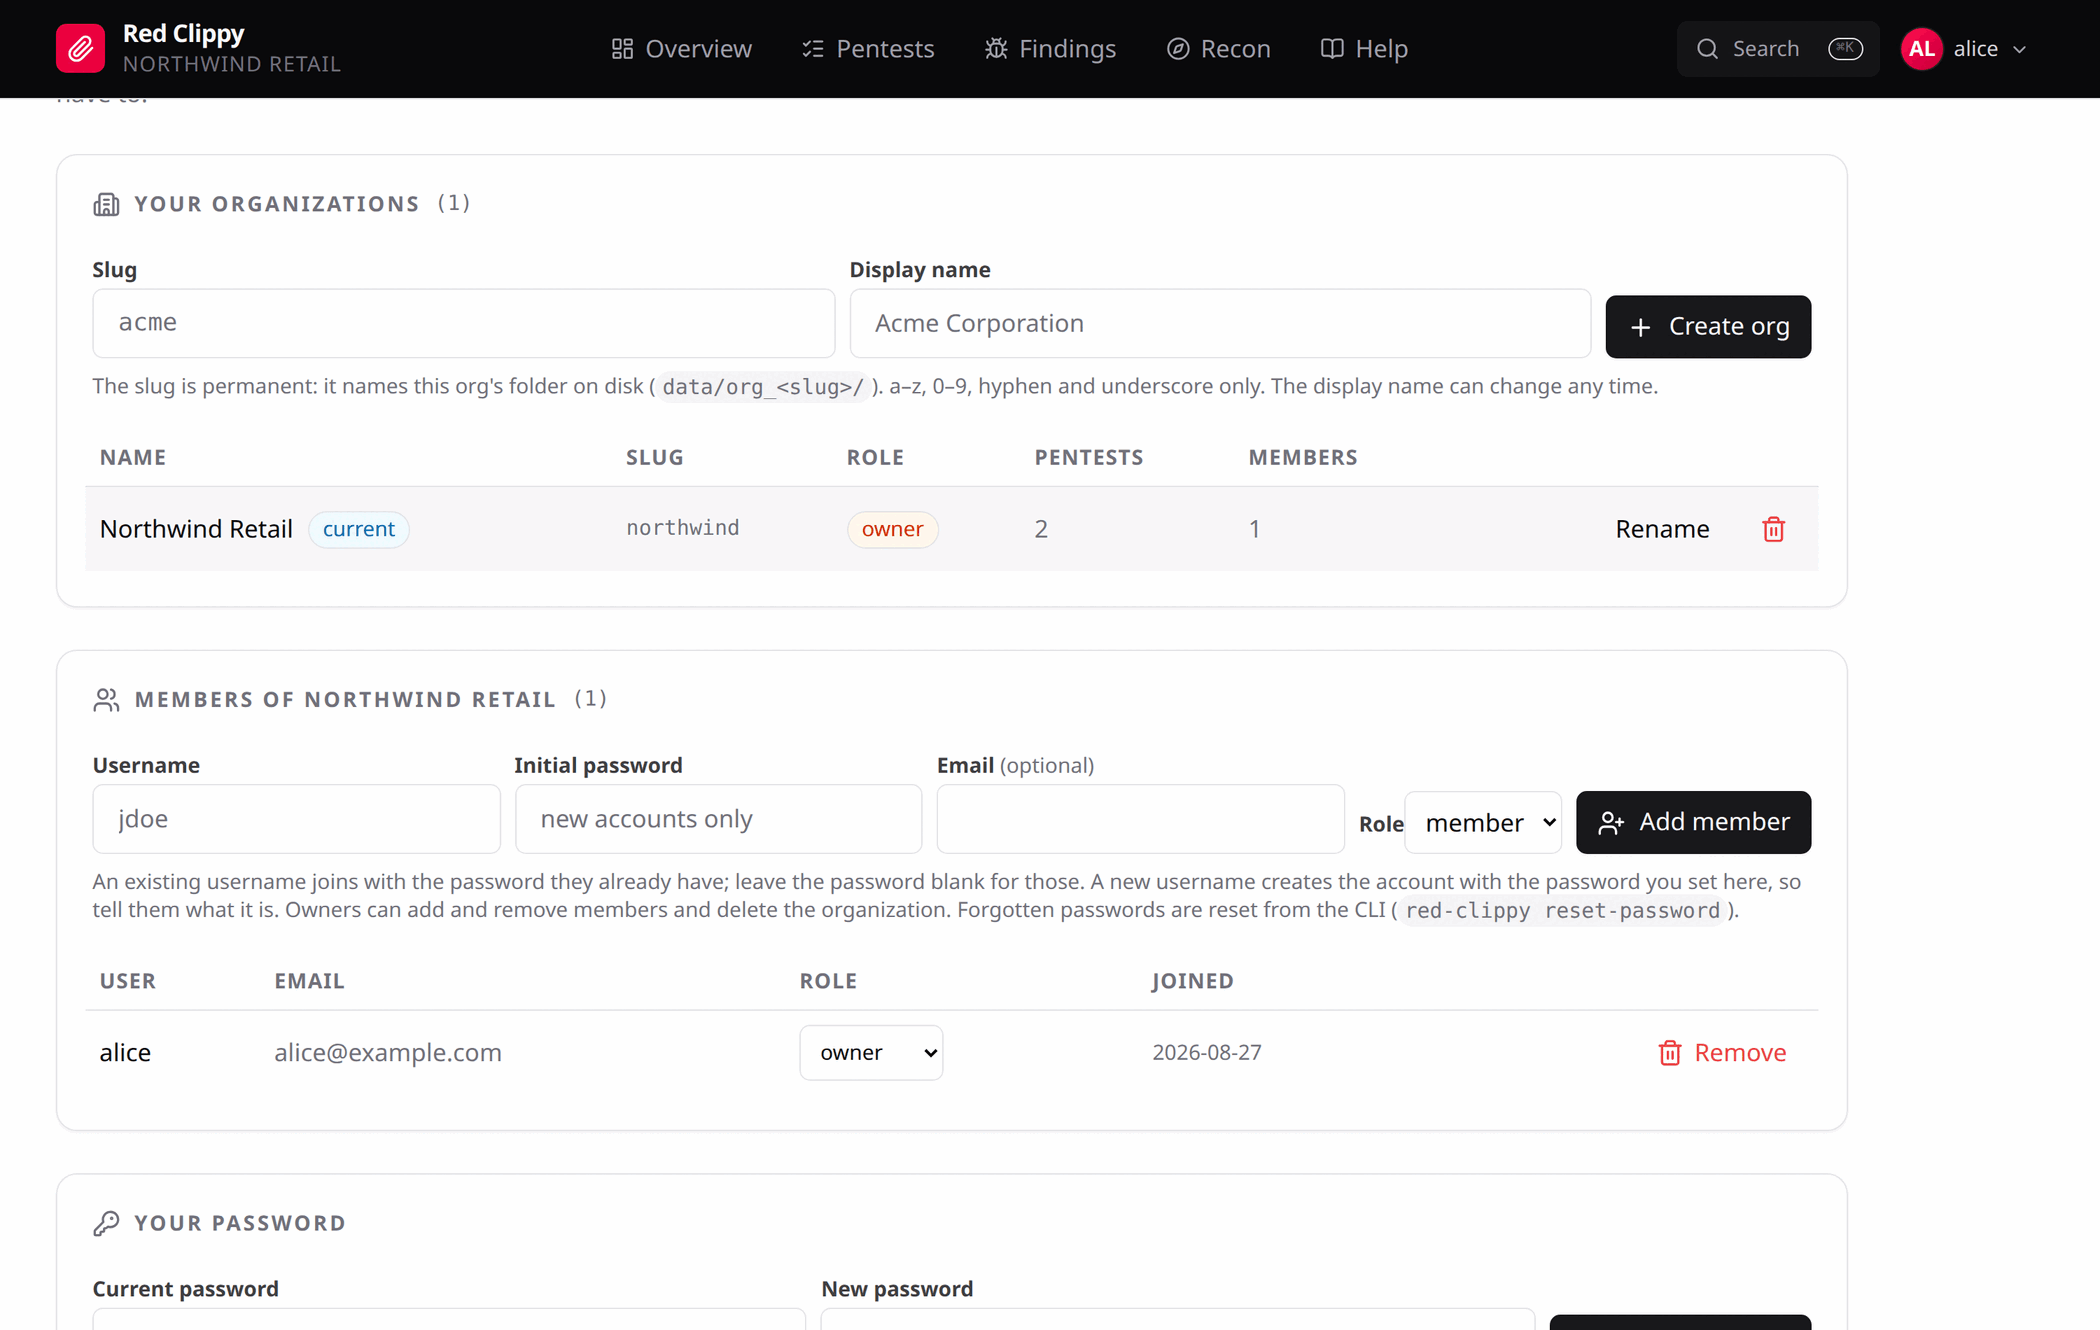
Add member behaves differently depending on whether the username already exists:
- an existing username joins with the password they already have, so leave the password field blank
- a new username creates the account with the password you type, so you have to tell them what it is
Roles are owner or member. Owners can add and remove members, change roles,
rename the organization and delete it. Members work the engagements and issue
their own API keys.
Only owners see the add form and the role dropdowns. The server enforces the same rules regardless of what the browser shows, so a hidden button is a convenience, not the control.
Removing someone from an organization keeps their account and their API keys for other organizations. It only removes this membership.
One organization per client
One organization per client is about separation, not tidiness. An organization cannot see another’s data, and an API key belongs to exactly one organization. Give each client its own and connect one MCP server per organization. An agent working for one client then has no path to another’s findings.
Your password
The bottom card changes your own password. It asks for the current one, and changing it signs out your other sessions.
There is deliberately no “reset this member’s password” button. Any signed-in user can create an organization and invite any username into it, so an in-app reset would be an account takeover primitive. Forgotten passwords are reset from the CLI on the server:
red-clippy reset-password --username bob --password 'new-one'
Deleting an organization
Owners can delete, and it asks you to type the slug rather than clicking yes. Deletion removes every pentest, finding, asset, observation, scan and evidence record inside the organization, for every member.
Files on disk under <storage_root>/org_<slug>/ are deliberately left in
place. Remove them yourself if you want them gone. A mis-click therefore costs
you the index, not the artefacts.
Configuration
Settings come from a TOML file. red-clippy serve reads ./red-clippy.toml
if it exists, and otherwise runs entirely on built-in defaults. Copy the
example and edit:
cp red-clippy.toml.example red-clippy.toml
bind             = "127.0.0.1:7337"
database_url     = "sqlite://red-clippy.db?mode=rwc"
storage_root     = "./red-clippy-storage"   # uploaded evidence lives here
max_upload_bytes = 26_214_400               # 25 MiB
Settings
| Setting | Default | Meaning |
|---|---|---|
bind | 127.0.0.1:7337 | Address and port for the HTTP server. |
database_url | sqlite://red-clippy.db?mode=rwc | SQLx URL. SQLite is the supported backend. |
storage_root | ./red-clippy-storage | Directory for evidence and per-pentest files. Created at startup if missing. |
max_upload_bytes | 26214400 | Cap on a single upload, in bytes. |
frontend_dist | unset | Override for the built SPA. File-only. |
local_open | false | Allow the Files page to open folders on the server host. File-only. |
Relative paths are resolved against the working directory the server was
started in. Always cd into the folder holding the binary before launching it.
Precedence
Per field: CLI flag > environment variable > TOML > built-in default.
| Setting | CLI flag | Environment variable |
|---|---|---|
bind | --bind, -b | RED_CLIPPY_BIND |
database_url | --database-url | RED_CLIPPY_DATABASE_URL |
storage_root | --storage-root | RED_CLIPPY_STORAGE_ROOT |
max_upload_bytes | --max-upload-bytes | RED_CLIPPY_MAX_UPLOAD_BYTES |
| config file path | -c, --config | RED_CLIPPY_CONFIG |
The database and storage flags are global, so red-clippy init-db and the
other CLI helpers honour them too.
An unrecognised key in the TOML file stops startup with an error instead of
being ignored, so a typo like bnid fails loudly rather than leaving the
server quietly on a default.
File-only settings
frontend_dist points at a directory holding a built SPA. Release binaries
embed frontend/dist at compile time, so this is normally unset and there is
no sidecar directory to ship. Set it to serve a patched bundle without a Rust
toolchain; the server then reads <frontend_dist>/index.html and
<frontend_dist>/assets/.
local_open lets the Files page’s “reveal in file manager” button shell out
to xdg-open, open or explorer.exe on the machine running the server.
It ships off. Turn it on only when the server is your own desktop in a
logged-in graphical session. Under systemd, or when you are reaching the panel
across a network, there is no session for it to open into.
Logging
Log filtering uses RUST_LOG, defaulting to info,sqlx=warn. Logs go to
stderr.
RUST_LOG=debug ./red-clippy serve         # verbose
RUST_LOG=warn ./red-clippy serve          # quiet
RUST_LOG=info,sqlx=info ./red-clippy serve  # include SQL
Network exposure
Red Clippy binds to 127.0.0.1 and is meant to run on your own machine, next
to the agent driving it. It is not built to be exposed to a network or the
internet: there is no TLS, no rate limiting on the login form, and API keys
grant full access to everything in their organization.
If you do change bind, put it behind TLS and treat the API keys like the
passwords they are.
Command line
The same binary that serves the panel also carries a handful of subcommands.
Most of the time you only need serve. The rest exist for the things the
browser deliberately cannot do, such as resetting a forgotten password, and for
scripting the initial set-up of a machine.
red-clippy [OPTIONS] <COMMAND>
| Command | What it does |
|---|---|
serve | Run the web UI and REST API. |
mcp | Run the MCP stdio server, proxying to a running instance. |
init-db | Apply migrations against the configured database. |
create-org | Create an organization. |
create-user | Create a user. |
add-member | Add a user to an organization. |
reset-password | Break-glass password reset. |
create-api-key | Issue an API key. |
Four options are global and apply to every subcommand: -c / --config,
--database-url, --storage-root and --max-upload-bytes. That matters for
the helper commands: without it, running create-user with
RED_CLIPPY_DATABASE_URL set would create the user in the default database
rather than the one you meant.
Add --help to any subcommand for its own flags.
serve
red-clippy serve [-b HOST:PORT]
Runs migrations if needed, then serves the panel and the API. Stays in the
foreground; Ctrl+C stops it.
mcp
red-clippy mcp --url http://127.0.0.1:7337 --api-key rcl_xxxx_yyyy [--pentest CODE]
| Flag | Environment variable | Meaning |
|---|---|---|
--url | RED_CLIPPY_URL | Base URL of the running server. Defaults to http://127.0.0.1:7337. |
--api-key | RED_CLIPPY_API_KEY | Org-scoped token. Required. |
--pentest | RED_CLIPPY_PENTEST | Numeric id or exact code of an engagement to pin the session to. |
This speaks JSON-RPC 2.0 on stdin and stdout. Your MCP client launches it; you do not normally run it by hand except to check that the URL and key work. See Connecting an agent over MCP.
init-db
red-clippy init-db
Applies migrations and prints ok. serve does this on startup, so this is
for pre-creating a database or checking that a migration applies cleanly.
create-org
red-clippy create-org --slug xyz --name "XYZ Example Corp"
Fails if the slug is taken. The slug names the organization’s directory on disk and cannot be changed afterwards.
create-user
red-clippy create-user --username bob --password 's3cret-pass' --email bob@example.com
--email is optional. This creates the account only; it does not join any
organization.
add-member
red-clippy add-member --username bob --org xyz --role owner
--role is owner or member, defaulting to member. Run it again with a
different --org to give one person access to several tenants.
reset-password
red-clippy reset-password --username alice --password 'new-one'
Sets the password and signs the user out everywhere. This is the only way to reset a password you do not know, and it needs shell access on the server host. See Organizations and members for why.
create-api-key
red-clippy create-api-key --username alice --org xyz --name laptop
Prints the token once:
created api key id=1 name=laptop
token (store this now - it will not be shown again):
    rcl_1a2b3c4d_5e6f708192a3b4c5d6e7f8091a2b3c4d5e6f7081
The user must already be a member of the organization. --name defaults to
default; give it something that will still mean something in six months.
Only the prefix and a hash are stored, so a lost token cannot be recovered. Issue a new one and revoke the old.
Troubleshooting
Each heading below is a symptom. Find the one that matches what you are seeing and work from there.
The browser shows a login form on a fresh install
You cannot get past it, because no account exists yet. Normally the panel detects that and shows the setup wizard instead; if it shows the login form, the detection request failed.
The form says so when that happens: it warns that GET /api/v1/bootstrap could
not be reached. Two causes:
- the server binary is older than the SPA it is serving, so the endpoint does not exist. Rebuild, or use a matching release.
- a proxy in front of the panel is not forwarding
/api.
Check it directly:
curl -s http://127.0.0.1:7337/api/v1/bootstrap
# {"needs_setup":true}
The setup wizard never appears
It only appears while the database has no users, and it refuses to run once one exists. If you have an account but cannot get in, reset the password:
red-clippy reset-password --username alice --password 'new-one'
Run that on the server host, in the directory holding the database, or with
--database-url pointing at it.
Nobody can sign in
Sign-in takes a username, a password, and an optional organization slug. The slug is only needed to pick a specific organization; leave it blank for your default. Getting the slug wrong is a common cause of a login that looks broken.
If you are sure the credentials are right, check you are talking to the database you think you are. The server prints its storage path at startup, and the database path comes from the same config.
The panel loads but every page is empty
You are probably in the wrong organization. The display name under the logo says which one. Switch from avatar menu > Organizations.
The MCP server is not connecting
Work through it in order:
- Is
red-clippy serverunning? The MCP process is a proxy to it, not a replacement for it.curl -s http://127.0.0.1:7337/api/v1/health - Is the key valid? A revoked key fails on every call. Check its state in Settings > API keys.
- Is the command path right? Your client launches the binary by path.
red-clippyon its own only works if the binary is on the client’s PATH, which it usually is not. Copy the command from Connect MCP, where the path is filled in. - Run the Shell (manual test) snippet from that same section. It should sit and wait for input. If it exits immediately, the error it prints names the problem.
For Claude Code specifically, claude mcp list shows whether the server is
connected.
An agent writes to the wrong engagement
Either the session is not pinned, or it is pinned to the wrong one. Pin it with
--pentest or RED_CLIPPY_PENTEST, using the numeric id or the exact code.
A code has to match exactly, including case.
Without a pin, write tools require an explicit pentest_id on every call, and
an agent that guesses will guess wrong eventually.
An agent writes to the wrong client
An API key belongs to one organization, so this means the wrong key. Use one working folder per client with the MCP server added inside it, and launch the agent from that folder. See Connecting an agent over MCP.
A scan says the tool is not installed
The scan engine shells out to tools on the machine running red-clippy serve,
not on your machine and not inside the agent’s environment. The Scanner page
shows availability per tool and gives the install command:
| Tool | Install |
|---|---|
nmap | apt install nmap |
masscan | apt install masscan, and the server needs root or cap_net_raw |
naabu | go install github.com/projectdiscovery/naabu/v2/cmd/naabu@latest |
subfinder | go install github.com/projectdiscovery/subfinder/v2/cmd/subfinder@latest |
Availability for the display is probed once at startup and cached, so a tool installed while the server is running still shows as missing until you restart. Launching a scan re-checks for real, so if you know it is there you can start the run anyway.
An import says the format is not recognised
The parser sniffs the content. Two things trip it up:
- nmap text or grepable output. Only XML (
-oX) is consumable, because it is the only format carrying service, version and script results. - subfinder output. A bare list of hostnames is too generic to detect
safely, so it is only parsed when the format is named. Use the Subfinder
card, or pass
"format": "subfinder"to the API.
Ports appear twice
They should not: ports are matched on host, port and protocol, so a re-import
updates rather than duplicates. If you are seeing two rows, check whether they
differ in protocol or in host spelling. shop.example.com and the IP it
resolves to count as different hosts.
Coverage went down after a recon run
Working as intended. The percentage counts every check across every asset you have opened, so opening new assets adds checks to the total.
“Reveal in file manager” does nothing
It is off unless local_open = true is set in the config file, and even then
it opens a folder on the machine running the server. On a headless server
there is no graphical session for it to open into. See
Configuration.
An upload is rejected as too large
The default cap is 25 MiB per file. Raise max_upload_bytes in the config, or
put the artefact in the Files area instead, which is the better home for a
120 MiB packet capture anyway.
Startup fails complaining about a config key
An unrecognised key is an error rather than a warning, so a typo cannot leave you quietly on a default. The message names the key. The valid ones are in Configuration.
Increasing log verbosity
RUST_LOG=debug ./red-clippy serve
RUST_LOG=info,sqlx=info ./red-clippy serve   # include SQL
Logs go to stderr.
Reporting a bug
Bug reports go to the issue tracker. Security issues should be reported privately instead, following SECURITY.md.
REST API
Red Clippy serves a REST API at /api/v1, on the same address and from the
same process as the web panel. The panel is built on this API, so every
operation available in the browser is available to a script or an agent through
the same endpoints.
Authentication
Authorization: Bearer rcl_<prefix>_<secret>
Keys are organization-scoped, so no endpoint takes an organization in its path.
Issue one under Settings > API keys or with red-clippy create-api-key.
The API also accepts the session cookie, so the same-origin SPA can call it without a key. Cookie sessions are re-checked against the membership table on every request, so access ends when the membership does rather than when the cookie expires.
Three endpoints need no authentication, because they run before there is
anyone to authenticate: GET /health, GET /cvss/score, and the bootstrap
pair. The bootstrap endpoints both refuse once any user exists.
Request and response format
Lists are paginated:
{ "items": [ ... ], "total": 137, "page": 1, "page_size": 50 }
page starts at 1 and page_size defaults to 50 with a ceiling of 500.
Errors are JSON with a single field:
{ "error": "invalid asset kind `host` - use one of: domain, ip, url, api, mobile" }
| Status | When |
|---|---|
| 400 | Bad request. The message names the problem and, for closed vocabularies, the accepted values. |
| 401 | Missing, malformed, revoked or expired credentials. |
| 403 | Authenticated but not permitted, typically an owner-only action. |
| 404 | Not found, or belongs to another organization. The response does not distinguish the two. |
| 409 | Conflict, such as a duplicate slug or code. |
| 500 | Server error. The detail goes to the log, not the response. |
Endpoints
System
| Method and path | Purpose |
|---|---|
GET /health | Liveness. |
GET /cvss/score?vector=... | Score a CVSS 3.1 vector. |
GET /bootstrap | Whether first-run setup is still available. |
POST /bootstrap | Create the first organization and administrator. |
GET /me | The current identity, organization, and the server’s own binary path. |
Pentests
| Method and path | Purpose |
|---|---|
GET /pentests | List, filterable by q and status. |
POST /pentests | Create. |
GET /pentests/{id} | Fetch. |
PATCH /pentests/{id} | Update. |
GET /pentests/{id}/summary | Counts, recent items and phase progress in one call. |
GET /pentests/{id}/severity | Severity counts. |
GET /pentests/{id}/coverage | Check coverage rollup. |
Phases and checks
| Method and path | Purpose |
|---|---|
GET, POST /pentests/{id}/phases | List and create. |
PATCH, DELETE /pentests/{id}/phases/{phase_id} | Update status and notes, or remove. |
GET /pentests/{id}/checks?asset_id=N | The catalogue for one asset. Materialises it on first call. |
PATCH /pentests/{id}/checks/{check_id} | Set status and notes. |
POST /pentests/{id}/assets/{asset_id}/checks/bulk | Bulk update on one asset. |
Assets
| Method and path | Purpose |
|---|---|
GET, POST /pentests/{id}/assets | List and create. |
GET /assets | Every asset in the organization, with its pentest. |
GET, PATCH, DELETE /assets/{id} | Fetch, update, delete. |
DELETE /pentests/{id}/assets/by-value | Delete by value. |
POST /pentests/{id}/assets/scope | Set marking by value. |
POST /pentests/{id}/assets/scope/bulk | Set the same marking on many values. |
GET, POST /assets/{id}/aliases | List and add aliases. |
DELETE /assets/{id}/aliases/{alias_id} | Detach an alias. |
POST /pentests/{id}/assets/promote | Promote an observation to an asset. |
POST /assets/{id}/demote | Demote an asset back to an observation. |
GET /assets/{id}/observations | Observations attached to one asset. |
GET /pentests/{id}/assets/urls | URLs under an asset. |
GET /pentests/{id}/assets/urls/from-previous | URLs seen for this asset in earlier engagements. |
GET /pentests/{id}/assets/related | Related IPs and hostnames. |
GET /pentests/{id}/assets/ranges | Declared ranges containing an address. |
GET /pentests/{id}/assets/ports | Ports for one asset. |
Observations and ports
| Method and path | Purpose |
|---|---|
GET, POST /pentests/{id}/observations | List and create. |
POST /pentests/{id}/observations/bulk | Create many in one transaction. |
GET, PATCH, DELETE /observations/{id} | Fetch, update, delete. |
GET /observations | Every observation in the organization. |
GET /pentests/{id}/ports | Engagement-wide port and service search. |
IP ranges
| Method and path | Purpose |
|---|---|
GET, POST /pentests/{id}/ip-ranges | List and declare. |
PATCH, DELETE /pentests/{id}/ip-ranges/{range_id} | Update or remove. |
POST /pentests/{id}/ip-ranges/apply | Declare a range and fan the scope decision out to member addresses. |
GET /pentests/{id}/range-map | The unified scope tree behind the Network page. |
API endpoints
| Method and path | Purpose |
|---|---|
GET, POST /assets/{id}/api-endpoints | List and add. |
POST /assets/{id}/api-endpoints/bulk | Add many. |
GET /assets/{id}/api-endpoints/openapi | Export an OpenAPI 3.1 document. |
GET, PATCH, DELETE /api-endpoints/{id} | Fetch, update, delete. |
GET /api-endpoints/{id}/curl | Export as a cURL command. |
Findings and evidence
| Method and path | Purpose |
|---|---|
GET, POST /pentests/{id}/findings | List and create. |
GET /pentests/{id}/findings.xlsx | Excel export for one engagement, honouring the same filters. |
GET /findings | Every finding in the organization. |
GET /findings.xlsx | Excel export for the organization. |
GET, PATCH, DELETE /findings/{id} | Fetch, update, delete. |
GET, POST /findings/{id}/attachments | List and upload evidence. |
GET, DELETE /findings/{id}/attachments/{attachment_id} | Download or delete one. |
Files
| Method and path | Purpose |
|---|---|
GET, DELETE /pentests/{id}/files | List a folder, or delete a path. |
POST /pentests/{id}/files/folders | Create a folder. |
POST /pentests/{id}/files/upload | Upload, as multipart with file, optional dir and optional name. |
GET /pentests/{id}/files/download | Download. |
POST /pentests/{id}/files/reveal | Open the folder on the server host, if local_open is on. |
/assets/{id}/files/... | The same set, scoped to one asset, plus read and write JSON variants. |
Tool output and scans
| Method and path | Purpose |
|---|---|
POST /pentests/{id}/ingest | Import a scanner report. |
GET, POST /pentests/{id}/nmap | List and attach raw nmap scans. |
GET /nmap/{id} | One scan with its raw output. |
GET /pentests/{id}/scan-tools | The tool registry with availability. |
GET /pentests/{id}/scan-coverage | Funnel progress. |
GET /pentests/{id}/scan-coverage/by-range | The same, per declared range. |
POST /pentests/{id}/scan-coverage/mark | Mark targets as already covered. |
GET, POST, DELETE /pentests/{id}/scans | List, launch, bulk-delete finished. |
GET, DELETE /pentests/{id}/scans/{scan_id} | Fetch one with its tasks, or delete. |
POST /pentests/{id}/scans/{scan_id}/cancel | Cancel. |
POST /pentests/{id}/scans/{scan_id}/tasks/{task_id}/skip | Skip one target. |
Attack graph and search
| Method and path | Purpose |
|---|---|
POST /edges | Create an edge. |
DELETE /edges/{id} | Delete an edge. |
GET /graph/neighbors | Nodes reachable from one node. |
GET /graph/paths | Paths between two nodes. |
GET /search | Organization-wide keyword search. |
Instructions
| Method and path | Purpose |
|---|---|
GET, PUT, DELETE /org/rt-instructions | Read, override, reset at the organization level. |
GET, PUT, DELETE /pentests/{id}/rt-instructions | The same for one engagement. |
Organizations, members and keys
| Method and path | Purpose |
|---|---|
GET, POST /orgs | List your memberships, or create an organization. |
PATCH, DELETE /orgs/{id} | Rename or delete. Owner only. |
GET, POST /orgs/{id}/members | List and add. |
PATCH, DELETE /orgs/{id}/members/{user_id} | Change role or remove. |
POST /session/org | Switch the active organization for a cookie session. |
POST /account/password | Change your own password. |
GET, POST /api-keys | List and issue. |
DELETE /api-keys/{id} | Revoke. |
Examples
KEY=rcl_1a2b3c4d_5e6f708192a3b4c5d6e7f8091a2b3c4d5e6f7081
BASE=http://127.0.0.1:7337/api/v1

# List engagements
curl -s -H "Authorization: Bearer $KEY" "$BASE/pentests"

# Add an asset
curl -s -X POST -H "Authorization: Bearer $KEY" -H 'Content-Type: application/json' \
  -d '{"kind":"domain","value":"shop.example.com","reachability":"up"}' \
  "$BASE/pentests/1/assets"

# File a finding
curl -s -X POST -H "Authorization: Bearer $KEY" -H 'Content-Type: application/json' \
  -d '{"title":"Reflected cross-site scripting in the search results page",
       "severity":"high","affected_asset":"shop.example.com",
       "cvss_vector":"CVSS:3.1/AV:N/AC:L/PR:N/UI:R/S:C/C:L/I:L/A:N",
       "tags":"asset:shop.example.com,check:WSTG-INPV-01"}' \
  "$BASE/pentests/1/findings"
MCP tool reference
red-clippy mcp exposes 82 tools. This page groups them by area so you can see
what is covered. The authoritative descriptions and JSON schemas come from
tools/list on the running server, which is what your agent actually reads.
Every tool is scoped to the organization the API key belongs to. Tools taking a
pentest_id accept the session pin instead when the server was started with
--pentest or RED_CLIPPY_PENTEST.
Engagements
| Tool | What it does |
|---|---|
list_pentests | List pentests, most recent first, paginated. Filters on free text and status. |
create_pentest | Create an engagement. The code is immutable afterwards. |
get_pentest_summary | One snapshot: severity counts, totals for findings, recon, assets and nmap scans, recon counts by kind, the testable in-scope asset count, five recent findings and scans, and phase progress. |
pentest_coverage | Check coverage rollup across every asset opened so far. |
Engagement phases
| Tool | What it does |
|---|---|
list_phases | List the phases for a pentest. |
add_phase | Add a custom phase. |
mark_phase | Set a phase’s status. |
delete_phase | Remove a phase. |
Red Team Instructions
| Tool | What it does |
|---|---|
get_instructions | Return the resolved document and the level it came from. |
set_instructions | Write an override at the org or pentest level. |
reset_instructions | Delete the override at a level, falling back to the next one down. |
Assets
| Tool | What it does |
|---|---|
list_assets | List scope units, with filters. |
create_asset | Create one. |
get_asset | Fetch one by id, including its attributes JSON. |
update_asset | Patch one by id. |
delete_asset | Delete by id. |
delete_asset_by_value | Delete by value. Cascades observations and check runs, and reports how many findings still tag the value. |
set_asset_marking | Set scope and reachability by value. |
bulk_set_asset_marking | Apply the same marking to many values in one transaction. |
list_asset_aliases | List aliases pointing at a canonical asset. |
set_asset_alias | Mark one asset as an alias of another. |
clear_asset_alias | Detach an alias, making it a standalone asset again. |
promote_observation | Turn an observation into its own asset. |
demote_asset | The inverse: turn an asset back into an observation under its parent. |
Observations and ports
| Tool | What it does |
|---|---|
list_observations | List observations for a pentest, paginated. |
create_observation | Add one. |
bulk_observations | Add many in one transaction. This is the one to use after a recon run. |
get_observation | Fetch one by id. |
update_observation | Patch one by id. |
delete_observation | Delete one by id. |
observations_for_asset | Everything attached to one asset, unpaginated. |
list_ports | Engagement-wide open port and service search. |
IP ranges
| Tool | What it does |
|---|---|
list_ip_ranges | The customer-declared perimeter, which is not the same thing as asset rows. |
add_ip_range | Declare a range. |
update_ip_range | Replace the editable fields of one. |
apply_ip_range | Declare a range and fan its scope decision out to every IP asset inside it. |
delete_ip_range | Remove a declared range. |
asset_ranges | Which declared ranges contain a given address. |
get_range_map | The unified scope tree: declared ranges, discovered clusters, loose blocks, singletons. |
API endpoints
| Tool | What it does |
|---|---|
list_api_endpoints | List endpoints on an api asset. |
add_api_endpoint | Attach one. |
add_api_endpoints_bulk | Attach many in one call, for importing a specification. |
get_api_endpoint | Fetch one with its JSON fields parsed. |
update_api_endpoint | Patch one. |
delete_api_endpoint | Delete one. |
export_api_endpoint_curl | Build a copy-pastable cURL command using the parent asset as the base URL. |
export_api_asset_openapi | Synthesise an OpenAPI 3.1 document from every REST endpoint on the asset. |
Methodology checks
| Tool | What it does |
|---|---|
list_checks | The catalogue for one asset, with current status per check. |
mark_check | Set one check’s status and notes. |
bulk_mark_checks | Flip many checks on a single asset to the same status, atomically. |
Findings and evidence
| Tool | What it does |
|---|---|
create_finding | Record a finding. |
list_findings | List findings for a pentest, paginated and filterable. |
get_finding | Fetch one in full: details, impact, proof of concept, remediation, CVSS, tags. |
update_finding | Patch one. |
delete_finding | Delete one, and its attachments. |
attach_evidence | Upload a file against a finding. |
list_evidence | List a finding’s attachments. Metadata only, no bytes. |
delete_evidence | Delete an attachment by id. |
create_finding’s description carries writing guidance the agent will follow:
confirm with the operator before recording a finding, keep details, impact and
remediation to a paragraph each, keep scope identifiers out of the title, and
describe what needs to change in remediation rather than emitting commands,
config snippets or library versions that may be wrong for the target’s stack.
Asset working files
| Tool | What it does |
|---|---|
list_asset_files | List files and folders under an asset’s directory. |
read_asset_file | Read one file. |
write_asset_file | Create or overwrite one. |
create_asset_folder | Create an empty folder. |
delete_asset_file | Delete a file, or a folder recursively. |
Tool output
| Tool | What it does |
|---|---|
ingest_tool_output | Import a scanner report. Auto-detects the format, writes assets, observations, findings and the raw scan in one transaction. |
add_nmap | Attach raw nmap output as a scan record. |
get_nmap_scan | Retrieve one scan by id, including its raw output. |
The scan engine
| Tool | What it does |
|---|---|
list_scan_tools | The tool registry by stage, with availability on this host. |
scan_coverage | Funnel progress, plus how many hosts are waiting for the next stage. |
scan_coverage_by_range | The same, broken down per declared in-scope range. |
mark_covered | Record targets as already scanned so future launches skip them. |
enqueue_scan | Launch a run. |
list_scans | Recent runs with status and progress counts. |
get_scan | One run with its per-target tasks. |
skip_scan_task | Skip one target inside a run, killing it if mid-scan. |
cancel_scan | Cancel a running scan. |
delete_scan | Delete one finished run. |
clear_scans | Bulk-delete finished runs. |
Attack graph
| Tool | What it does |
|---|---|
link | Create a directed edge between two nodes (observation, asset or finding) with a free-form relation. |
unlink | Delete an edge by id. |
neighbors | Everything reachable from a node up to depth edges (default 1, max 5), in a given direction. |
attack_paths | Paths from one node to another, up to max_depth hops (default 5, max 8). |
Search
| Tool | What it does |
|---|---|
org_search | Keyword search across every source table in the organization. |
Data model and vocabularies
Several fields are closed vocabularies. The strings below are the ones stored in the database and accepted by the API, and they are a contract: they will not be renamed under you.
Vocabularies
| Field | Values |
|---|---|
| Membership role | owner, member |
| Pentest status | planned, in_progress, completed, archived |
| Finding severity | critical, high, medium, low, info |
| Finding status | open, confirmed, remediated, accepted, false_positive |
| Asset kind | domain, ip, url, api, mobile |
| Asset reachability | up, down, blocked, or absent for not yet determined |
| IP range kind | in, out |
| API protocol | rest, graphql, soap, grpc |
| Phase status | pending, in_progress, done, na, blocked |
| Check status | not_tested, in_progress, tested, not_applicable, blocked |
| Graph node type | observation, asset, finding |
Parsing is case-insensitive and trims whitespace, so Up and OWNER are
accepted. Anything outside the list is a 400 whose message lists the valid
values.
Reachability has no “unknown” member on purpose: that state is the absence of a value, not a value.
Observation kinds
Unlike the vocabularies above, an observation’s kind is free text,
lowercased on write. The panel offers these:
port, service, dns_record, tech, cert, whois, email, employee,
credential_leak, secret, screenshot, asn, takeover_candidate,
default_cred_portal, wayback_url, js_endpoint, other
Sticking to them keeps the Recon drawer’s grouping and the cross-engagement views useful, but nothing stops you inventing one when you genuinely need it.
port is special: observations of that kind dedupe on
<host>:<port>/<proto>, so re-importing a host after a service scan merges
into the existing row rather than stacking a second one.
The check catalogue
The catalogue holds 135 checks, materialised per asset the first time you open that asset’s methodology tab. Each catalogue entry declares which asset kinds it applies to, which is why a domain gets 114 checks and an API asset gets 67.
The catalogue is re-synced from the binary on every startup, so upgrading picks up new and revised checks. Codes that have been withdrawn are deactivated rather than deleted, which leaves the check results you already recorded against them intact.
By standard:
| Standard | Checks |
|---|---|
| OWASP Web Security Testing Guide | 95 |
| CIS quick wins | 10 |
| OWASP API Security Top 10 | 10 |
| PTES | 3 |
| No external standard | the remainder |
By category:
| Category | Checks |
|---|---|
config | 24 |
input | 21 |
recon | 20 |
auth | 18 |
client | 14 |
business_logic | 10 |
session | 9 |
authz | 7 |
crypto | 4 |
cloud | 4 |
others (scanner, network, osint_paid, and the phase categories) | the remainder |
Each entry carries a code, title, description, category, standard and reference, an optional CWE, an optional suggested severity, and reference links.
Tag conventions
Finding tags are a comma-separated string. Two prefixes are understood by the panel:
| Tag | Effect |
|---|---|
asset:<value> | The finding appears on that asset’s Findings tab. |
check:<code> | The finding appears under that check in the workspace. |
Tag matching is exact on the comma-separated token, so asset:foo does not
match asset:foo.bar.
Everything else is free. manual, unverified, retest-passed and
client-confirmed are all reasonable, and they are searchable from the
findings list and the organization-wide Findings page.
Identifiers
Organization slug: lowercase letters, digits, hyphen and underscore. Fixed after creation because it names a directory.
Pentest code: 2 to 64 characters, starting with an alphanumeric, then
letters, digits, hyphen and underscore. Fixed after creation for the same
reason. Auto-generated as PT-YYYY-MM-DD-<slug> from the name, with a numeric
suffix if that is taken.
API key: rcl_<prefix>_<secret>. Only the prefix and a hash of the secret
are stored.
The attack graph
An edge links two nodes, each identified by a type (observation, asset or
finding) and an id, with a free-form relation string. Direction matters.
neighbors walks out from a node up to a depth (default 1, maximum 5) in a
direction (out, in or both). attack_paths finds paths between two
nodes up to a maximum depth (default 5, maximum 8).
Relations are free text, so resolves_to, hosts, credential_for,
pivots_to and same_owner_as are all valid without registering them
anywhere.
Stored representation
Vocabulary values are stored as their text spelling, not as integers, so a
database opened with any SQLite tool reads as critical rather than 0. A
stored value outside the vocabulary fails loudly on read rather than being
coerced to something plausible.
Files on disk
Red Clippy keeps two things outside the process: a SQLite database and a storage directory. Everything else is in the binary.
The database
The database is red-clippy.db in the working directory by default, or
wherever database_url points.
SQLite runs in WAL mode, so you will see three files:
red-clippy.db
red-clippy.db-wal
red-clippy.db-shm
All three belong together. Copying only the .db while the server is running
gives you a database missing the most recent writes.
The storage directory
The storage directory is ./red-clippy-storage by default, or wherever
storage_root points. It is created at startup if missing.
red-clippy-storage/
  org_xyz/
    pentest_PT-2026-Q3-XYZ/
      findings/
        2/
          9a9344b81c8e1bfb44740ab09b23d933
          aa26c30965cbc9533cf47261680b8c4e
      data/
        notes/checkout-flow.md
        scans/perimeter.xml
        scans/subfinder-example.txt
        screenshots/evidence.png
Each engagement has two buckets, and they name files differently.
findings/<finding_id>/ holds evidence attachments. Names are
server-generated random hex, so the original filename never touches disk and a
storage key lifted from an old database dump cannot be replayed against a
running server. The real filename, MIME type and caption live in the database.
data/ is the operator file area, the one behind the Files tab. It keeps
the names you gave things, so the Files tab is a faithful view of what is on
disk. Every path segment is validated, and nothing user-supplied can resolve
outside the engagement’s own data/ root.
Asset file areas are a slice of the same data/ tree, so a file written
through an asset’s Files tab is visible from the engagement’s Files tab too.
Backing up
With the server stopped, copy the database file (all three parts) and the storage directory. That is the whole state.
With the server running, use SQLite’s own backup so you get a consistent snapshot:
sqlite3 red-clippy.db ".backup 'backup/red-clippy.db'"
cp -a red-clippy-storage backup/
Deletion behaviour
Deleting a record and deleting its files are deliberately separate actions.
Deleting an organization in the panel removes every database row inside it and
leaves the files under org_<slug>/ alone. Deleting an asset removes its
observations and check results but keeps findings tagged against it.
In both cases a destructive action removes the index, not the artefacts. If you want the files gone, remove the directory yourself.
Path derivation
org_<slug> and pentest_<code> are derived from the slug and the code, which
is why both are immutable after creation. Both are re-validated every time a
path is built, so even a tampered database row cannot produce a path that
escapes the storage root.
This means one engagement’s artefacts are one directory. Archiving an
engagement is tar czf. Handing over a client’s files is copying
org_<slug>/.