Getting around
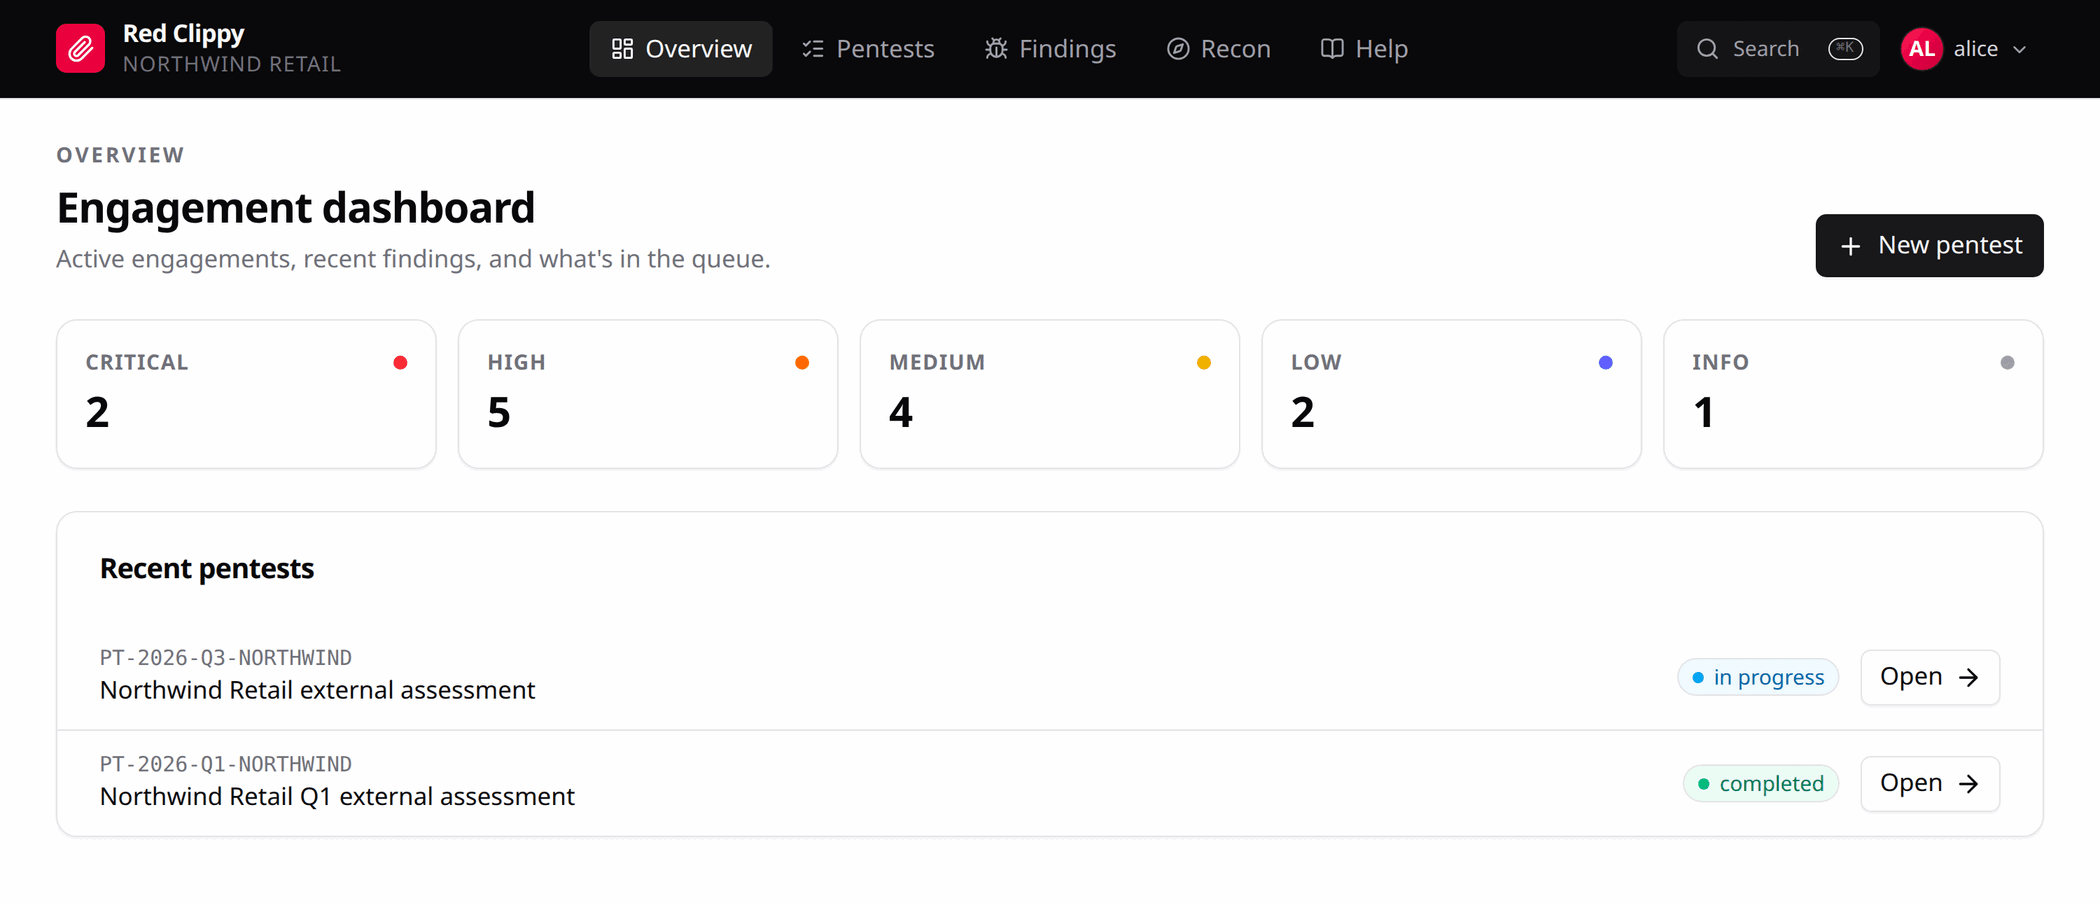
The panel is a single-page app served by the same binary that serves the API. Everything in it is reached from the top bar.
The top bar
Five links, left to right after the logo:
| Link | What it shows |
|---|---|
| Overview | The dashboard above: severity counts across the organization and your recent engagements. |
| Pentests | Every engagement in this organization, searchable and filterable by status. |
| Findings | Every finding across every engagement, in one list. |
| Recon | Every asset across every engagement, in one list. |
| Help | The in-app tutorial for connecting an agent. |
Under the logo is the display name of the organization you are currently working in. If it says the wrong client, you are in the wrong tenant. Switch from the avatar menu.
On the right:
- a Search button that opens the command palette
- the avatar menu, holding Organizations, Settings, the theme picker and Sign out
On a narrow screen the five links collapse into a drawer behind the menu button.
The dashboard
The severity tiles count findings across your 25 most recent engagements, not just the active one. A total that looks too high usually means an old engagement is still being counted.
The command palette
Press Ctrl+K (or Cmd+K on macOS) anywhere in the panel.
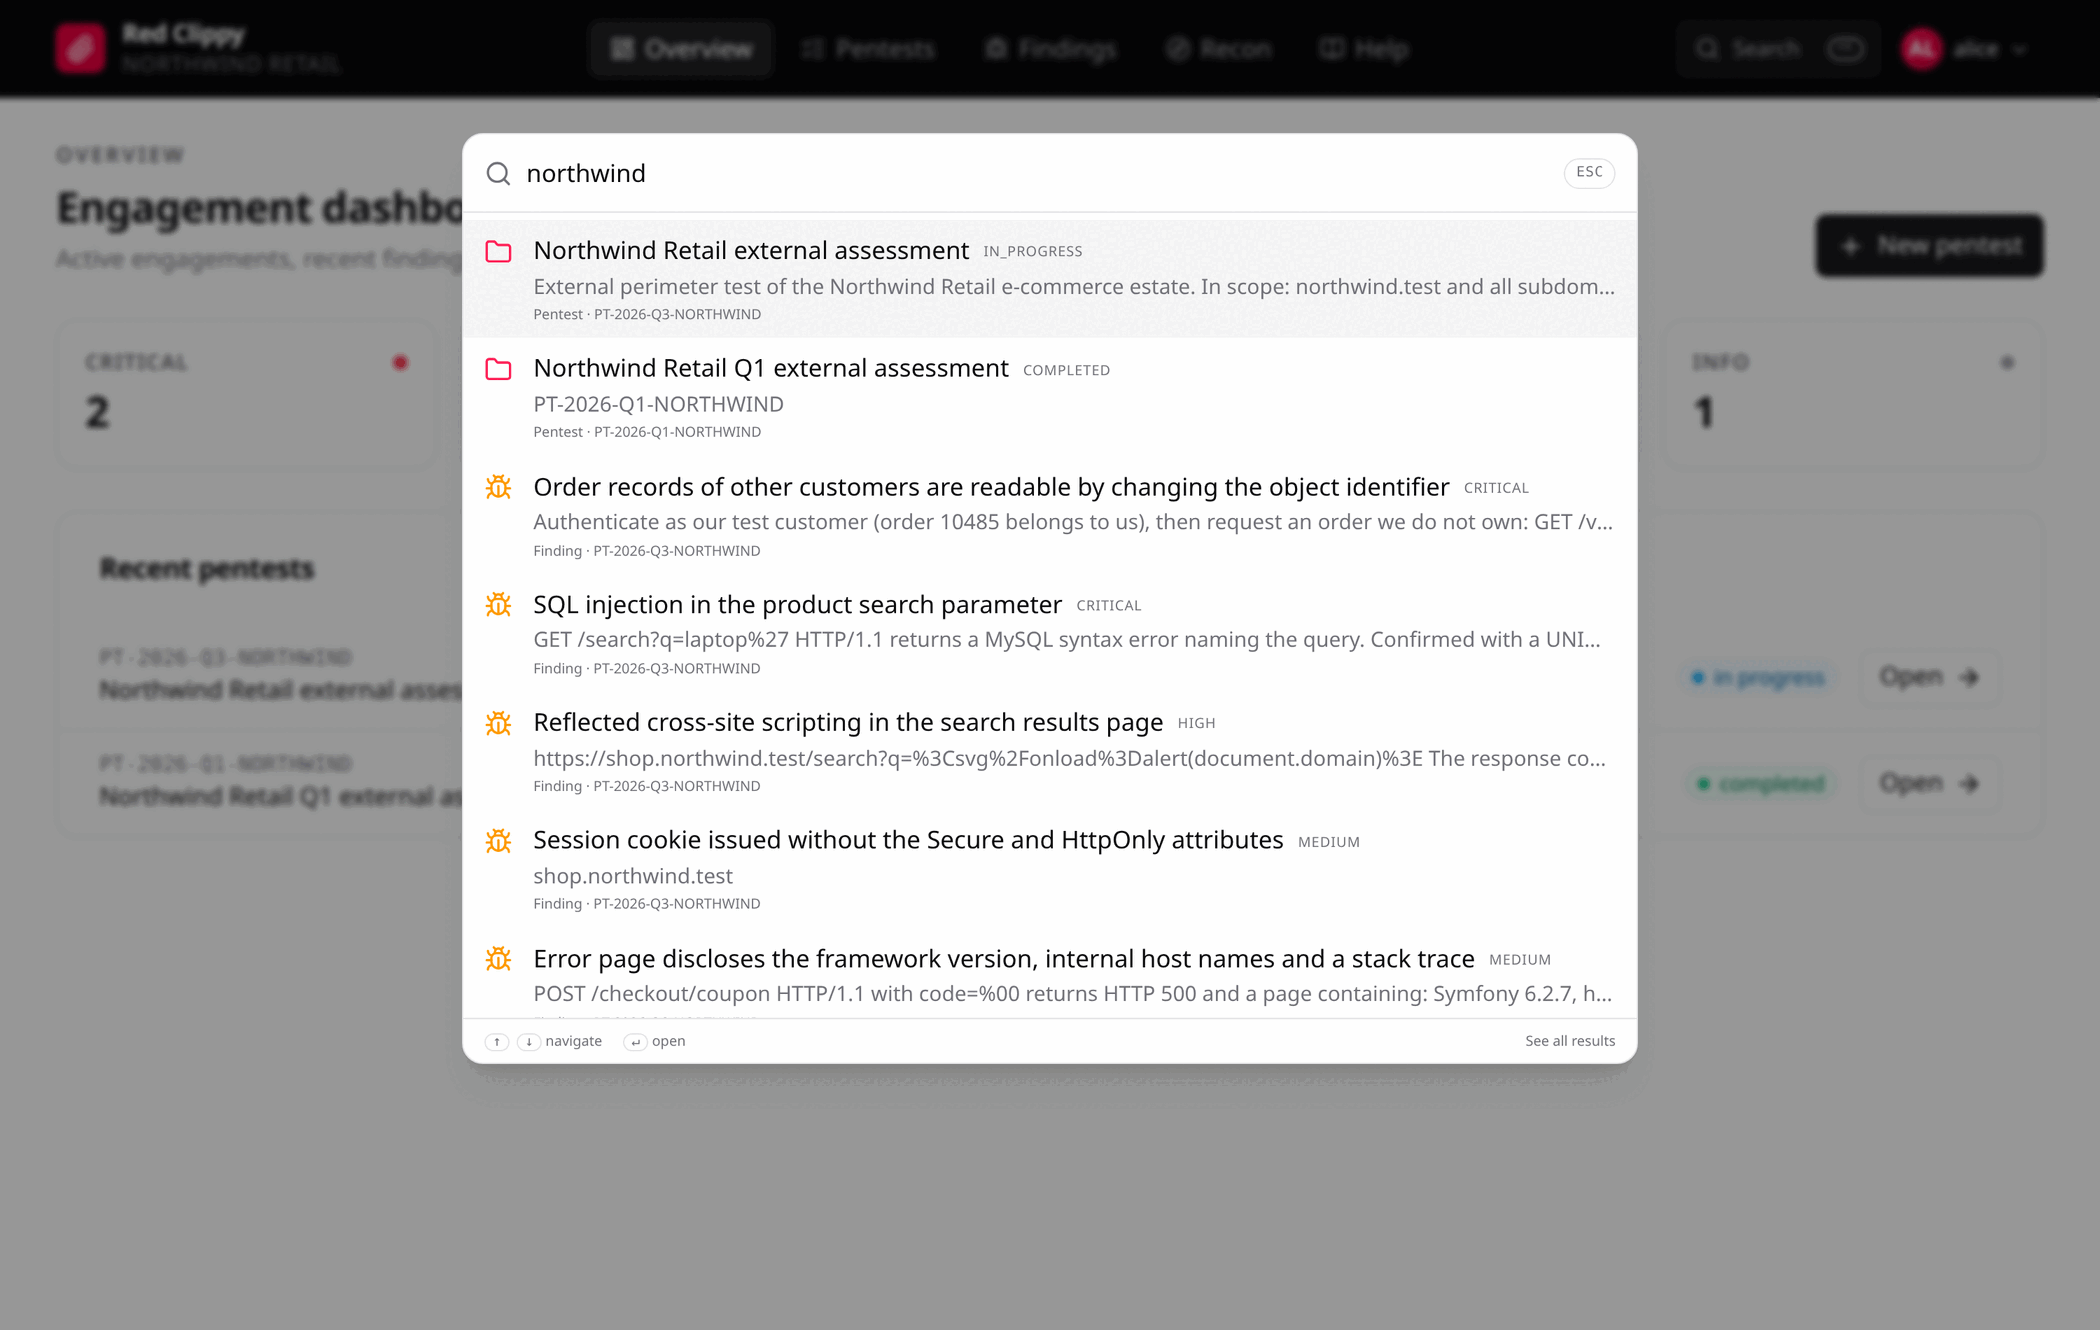
It searches across pentests, findings, assets, observations, phases and
attachments in the current organization at once. Each row says which kind of
record it is and which engagement it belongs to. Arrow keys move, Enter
opens, Escape closes.
Paste a hostname, an IP, a partial path, a username or a CVE identifier. When there are more matches than the palette can show, See all results opens the full search page, described in Searching across engagements.
Inside an engagement
Opening a pentest replaces the page with the engagement shell: a breadcrumb and title at the top, a row of tabs under it, and three buttons on the right.
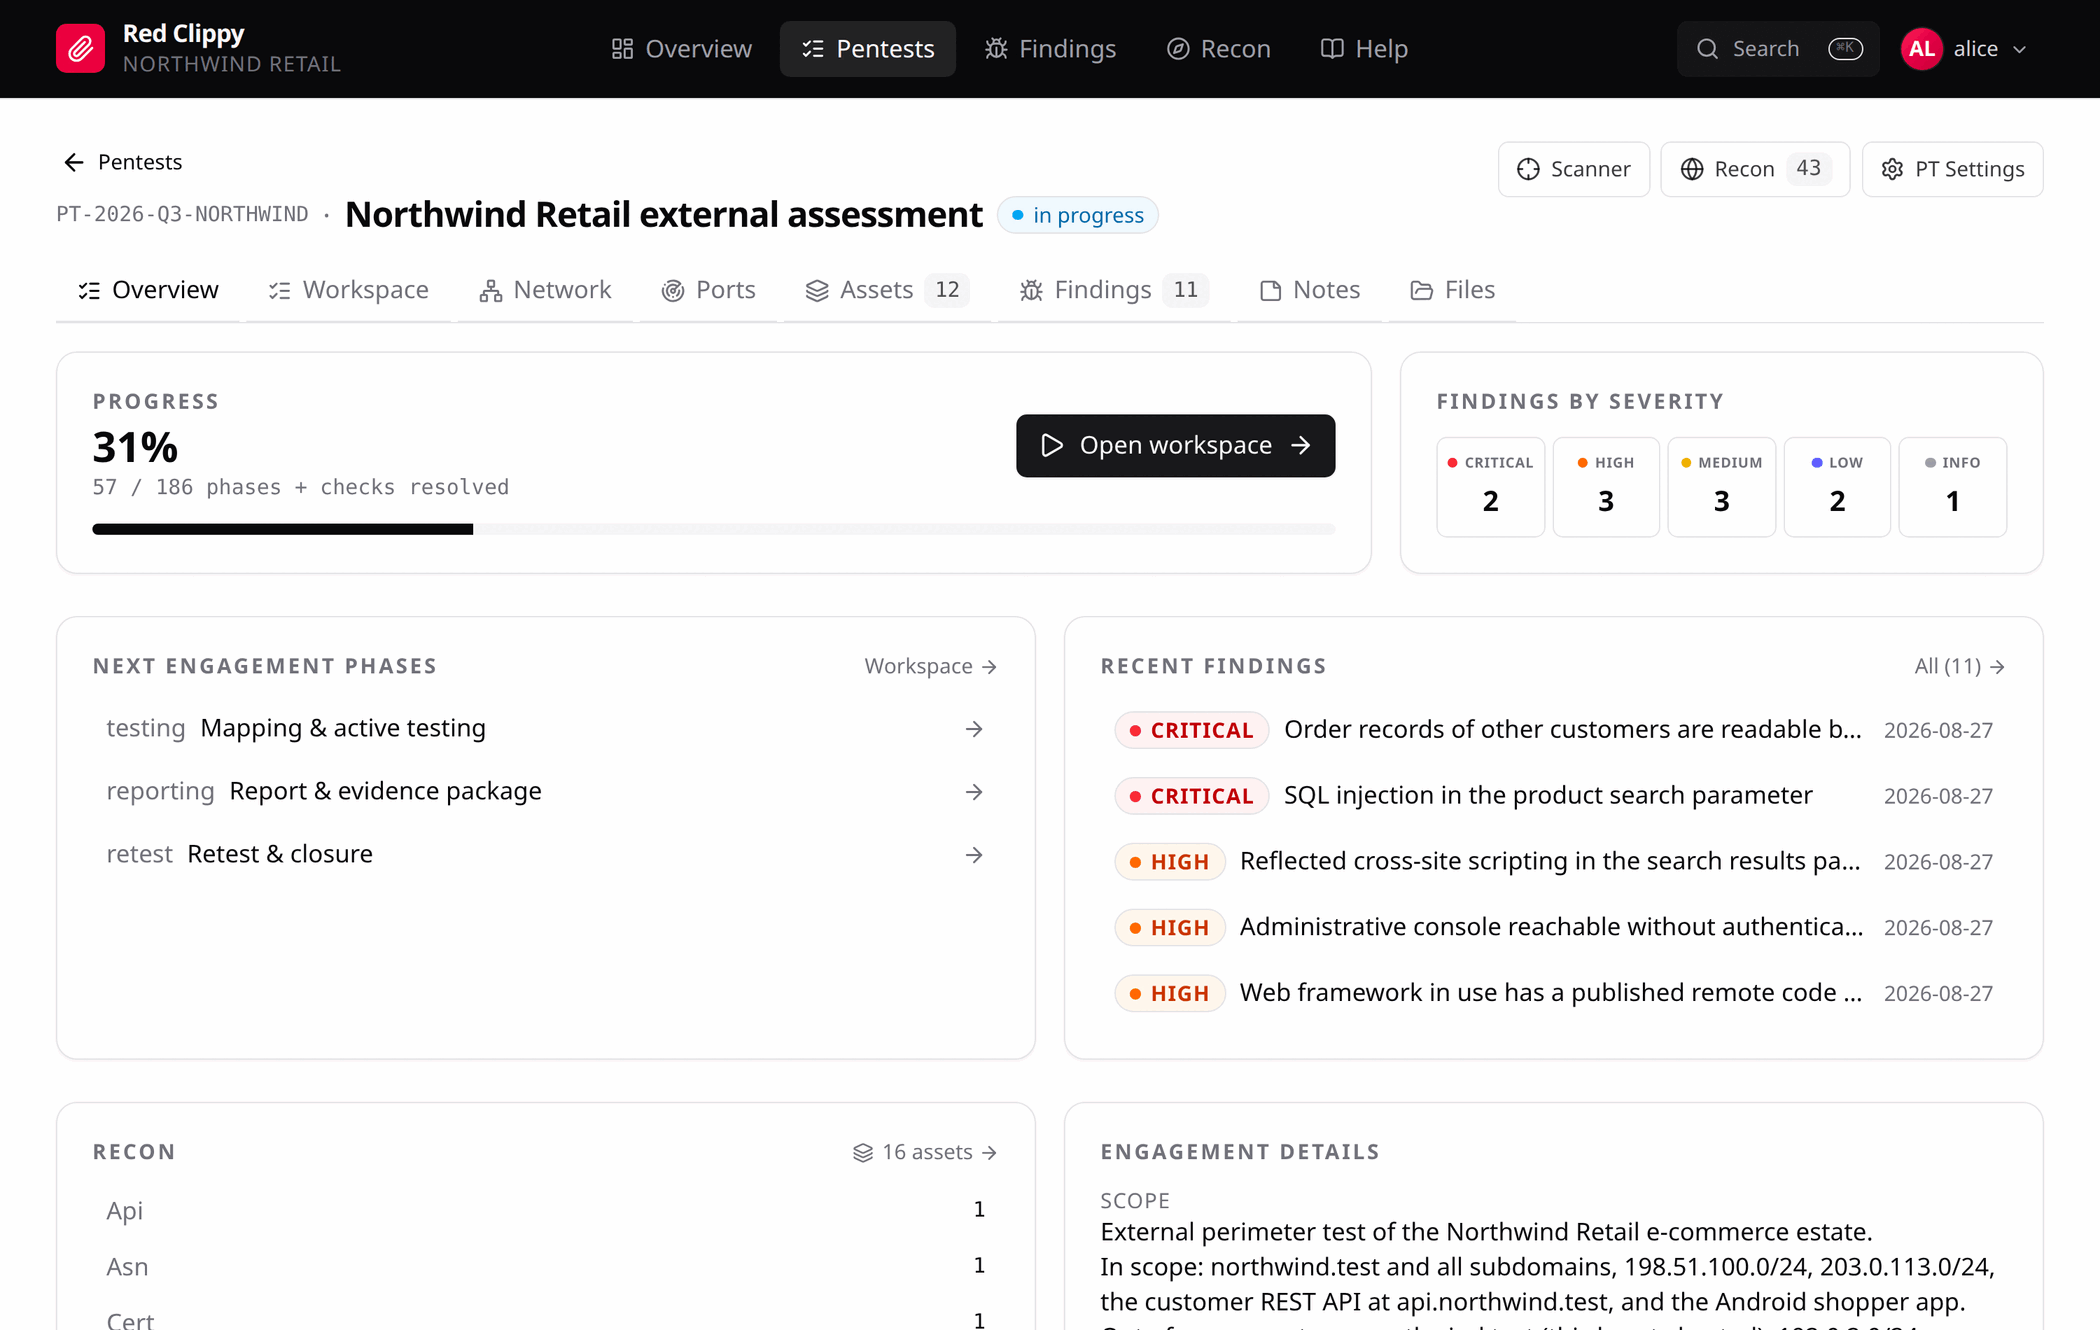
The tabs are:
| Tab | Page |
|---|---|
| Overview | Progress, severity breakdown, next phases, recent findings, engagement details. |
| Workspace | Engagement phases, and per-asset methodology when an asset is focused. |
| Network | Declared CIDR ranges and discovered IP clusters. |
| Ports | Every open port found in this engagement, grouped or tabulated. |
| Assets | The scope list: in scope, flagged, out of scope. |
| Findings | The findings for this engagement. |
| Notes | A full-page scratchpad. |
| Files | The engagement’s file area. |
The three buttons on the right stay put on every tab:
- Scanner opens the built-in scan engine
- Recon opens a side drawer listing this engagement’s observations, with a quick add form
- PT Settings opens engagement details and the Red Team Instructions override
Counts next to a tab are live. Assets counts in-scope, reachable assets only, since that is the remaining workload rather than the total inventory.
Theme
The theme picker in the avatar menu has three settings: System, Light and Dark. System follows the operating system and keeps following it. The other two pin the panel regardless of what the OS reports, which is useful when you are capturing screenshots for a report.