Ports and the scan engine
Two related pages. Ports shows what is open. Scanner is an optional built-in runner for going and finding out.
Ports
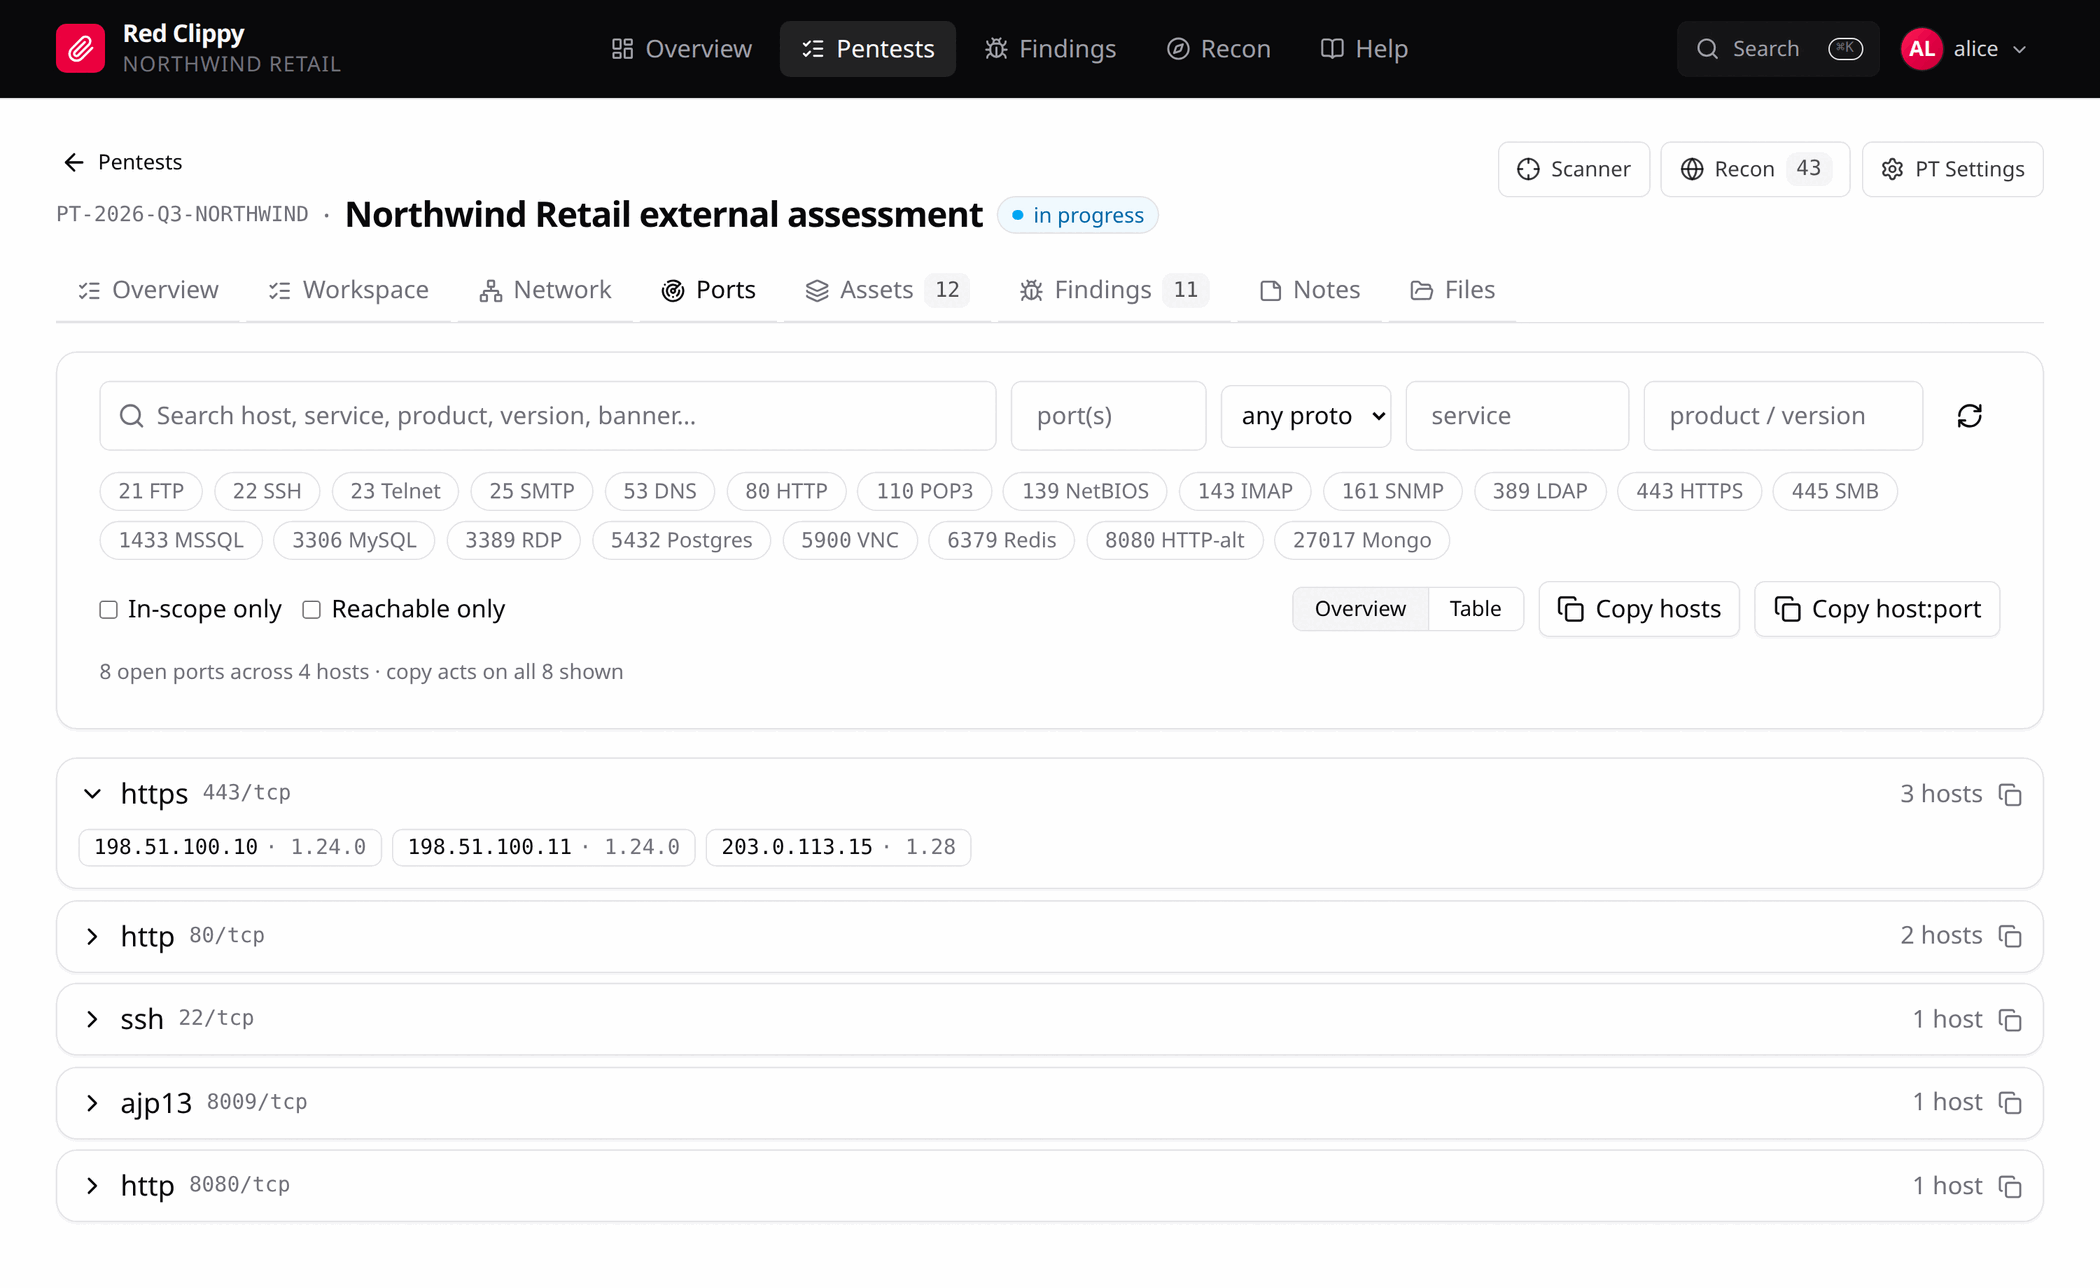
This page lists every open port in the engagement, taken from port
observations. Those arrive from a scanner import, from the built-in scan engine,
or from typing them in on an asset’s Ports tab. It does not matter which; they
all land in the same place.
The filter row narrows by free text (host, service, product, version, banner), by port number or range, by protocol, by service name and by product or version. The chips below are shortcuts for the ports you ask about most: 21 FTP, 22 SSH, 23 Telnet, 25 SMTP, 53 DNS, 80 HTTP, 110 POP3, 139 NetBIOS, 143 IMAP, 161 SNMP, 389 LDAP, 443 HTTPS, 445 SMB, 1433 MSSQL, 3306 MySQL, 3389 RDP, 5432 Postgres, 5900 VNC, 6379 Redis, 8080 HTTP-alt, 27017 Mongo.
In-scope only and Reachable only hide everything you have already excluded or marked as down.
Overview groups by service and port, with a host count on each; expanding a group lists the hosts. Table is one row per host and port, which is the view to use before copying the results somewhere else.
Copy hosts and Copy host:port put the current filtered set on the clipboard, in the format your next tool wants. The line under the filters spells out what that set currently is: “8 open ports across 4 hosts, copy acts on all 8 shown”. Check it before you copy, or you may take a filtered view for the whole list.
The scan engine
The Scanner button in the engagement header opens the built-in runner.
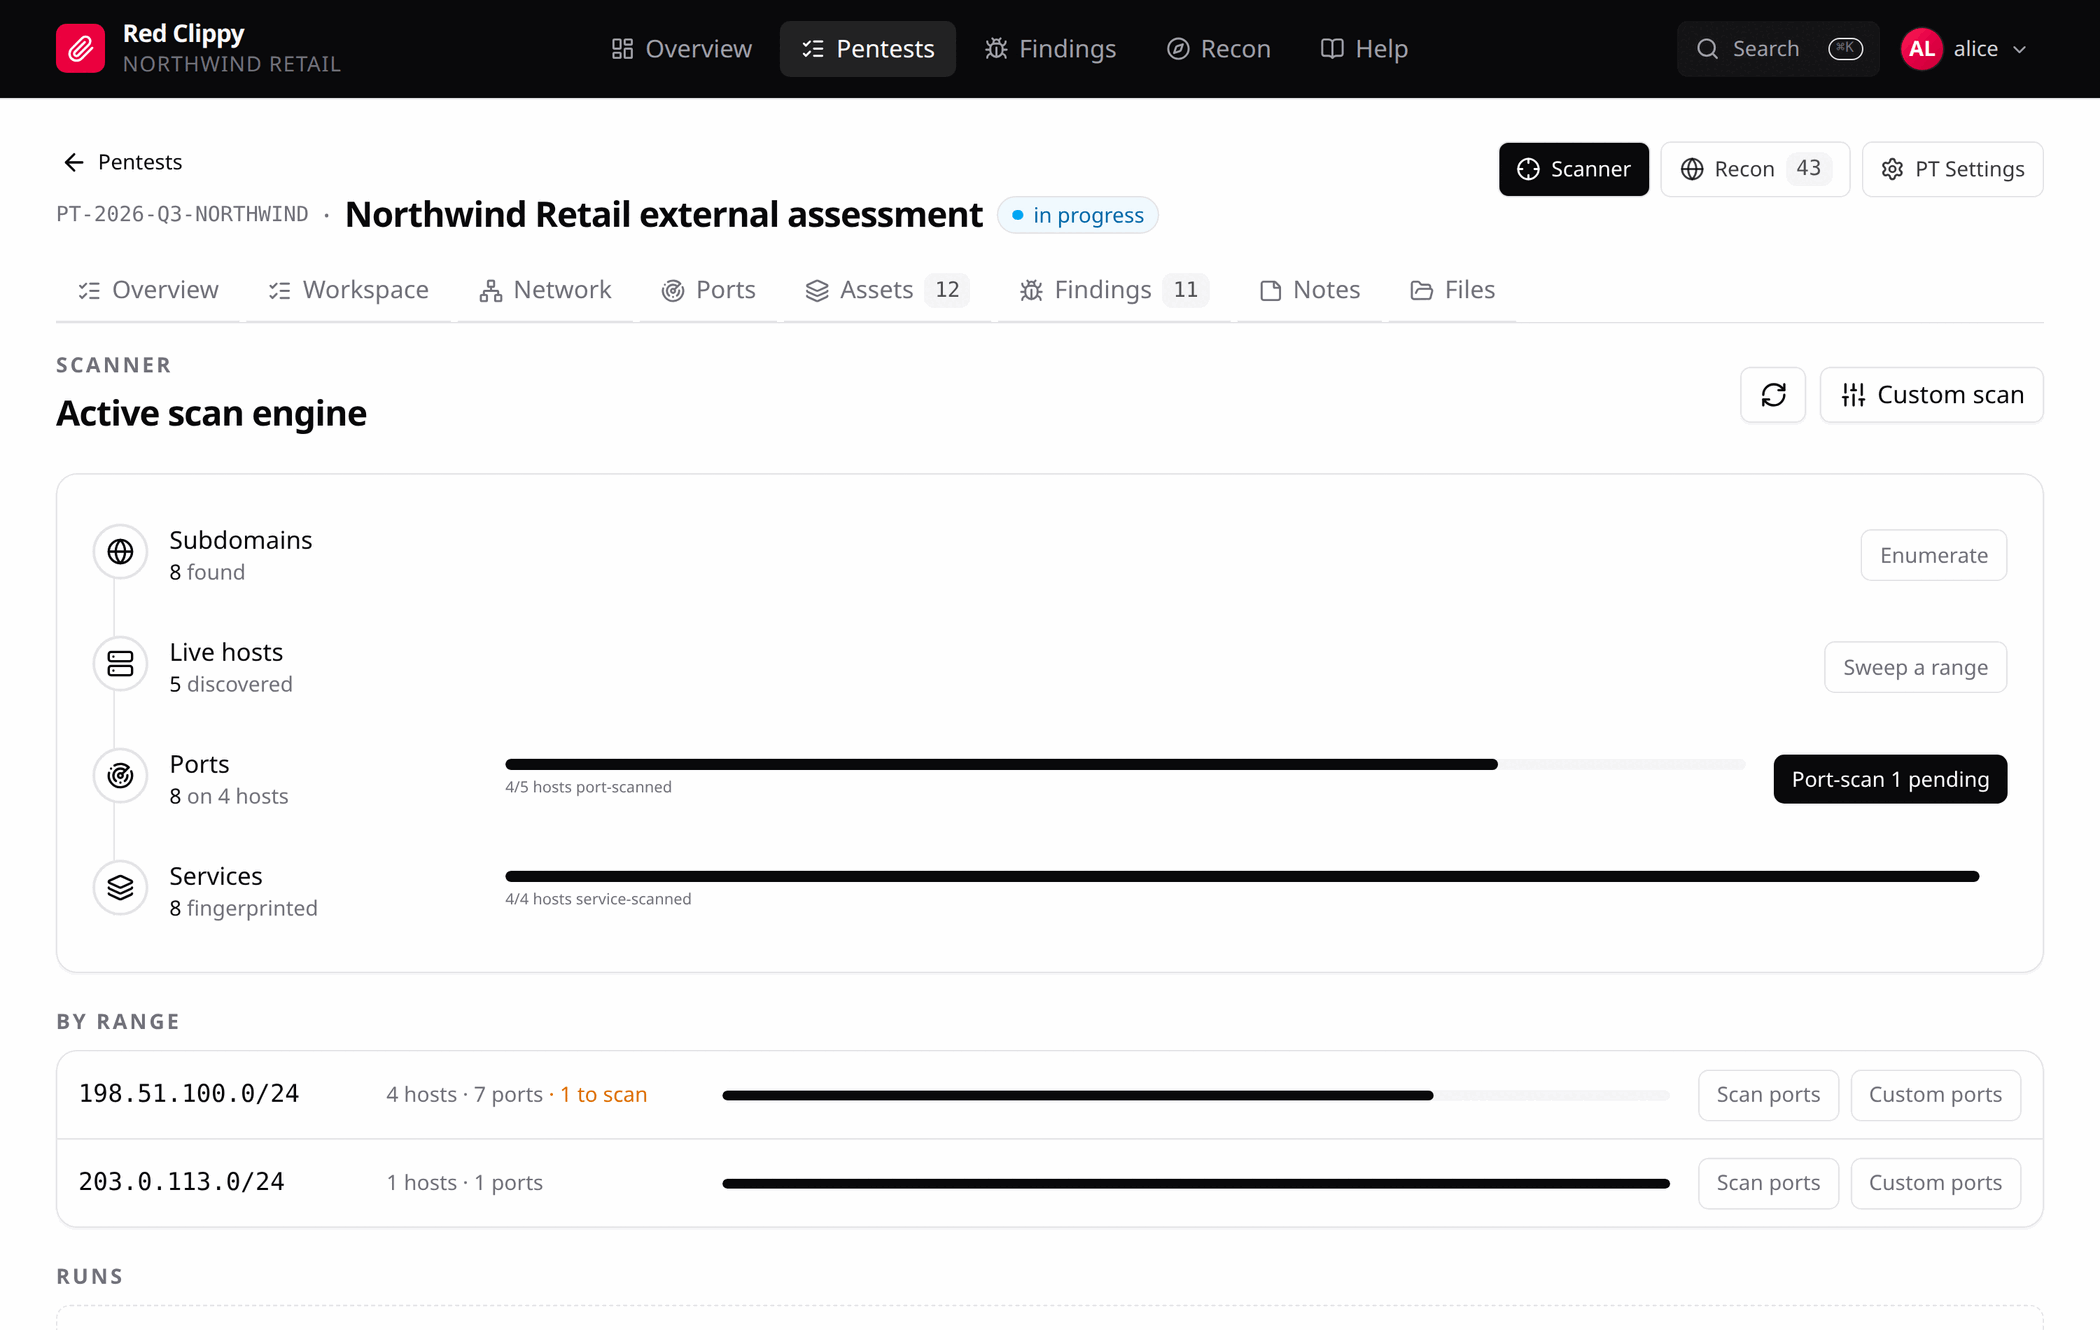
The scan engine is a convenience for working by hand. It shells out to tools
installed on the machine running red-clippy serve and ingests their output
through the same parsers as a manual import. It is not part of the agent-driven
workflow, where the agent runs its own tooling and posts the results back.
The funnel
Four stages, in order:
| Stage | Tool | What it does |
|---|---|---|
| Subdomains | subfinder | Passive subdomain enumeration for a domain. |
| Live hosts | nmap host sweep | Host discovery across a range. Probes ICMP plus common TCP and UDP ports including 135, 139, 445 and 3389, so it finds Windows hosts that block ping and serve nothing on 80 or 443. Works unprivileged. |
| Ports | nmap, naabu, masscan | Port scanning. Top 1000, all 65535, a custom list, naabu’s fast connect scan, or masscan’s SYN scan. |
| Services | nmap service scan | Service, version and default-script detection on hosts that already have an open port. |
Each row shows what has been found, with a progress bar for how much of the available surface that stage has covered. The button on the right launches the stage with sensible defaults. If a tool is not installed, the panel says so and gives you the install command instead of failing at run time.
masscan needs root or cap_net_raw. Everything else runs unprivileged.
Targets
A scan takes its targets from one of four sources:
| Source | Targets |
|---|---|
| Type targets | IPs, CIDRs or domains you type in. |
| In-scope ranges | Every declared in-scope range. |
| Live hosts | IP assets already discovered. |
| Open-port hosts | Hosts that already have at least one open port. |
Coverage and resumption
By range breaks coverage down per declared range: how many hosts, how many ports, and how many targets remain unscanned. Launching a scan skips targets already covered by an equivalent run, so re-running a stage after adding a range scans the new addresses only.
Scan ports and Custom ports on a range row launch that range directly.
You can also mark coverage by hand, for when you scanned something outside Red Clippy and want the funnel to stop asking for it.
Chaining
The custom scan drawer can queue follow-up stages: run host discovery, then automatically port-scan whatever came back alive, then service-scan whatever had a port open. The preview line at the bottom of the drawer spells out exactly what will run and against what before you commit to it.
Runs
Each run appears in the Runs list with its stage, status (running, done, failed, canceled), targets and results. Expand one to see per-target tasks, grouped by declared range. Running scans can be cancelled, individual tasks skipped, and finished runs cleared in bulk.
The page polls while anything is running, so results appear without a refresh.