Introduction
DARWIS Taka is a fast, modular web vulnerability scanner built in Rust. It combines a rule-based detection engine with optional AI-assisted verification, an intelligent crawler, and a web UI for managing scans and reviewing results.
This documentation covers the self-hosted Docker deployment of DARWIS Taka, maintained in the taka-docker repository. It is the recommended way to run Taka on your own infrastructure.
Docker Hub: cysecurity/darwis-taka
What is Taka?
Taka discovers web-application vulnerabilities using a YAML-based rule engine. Detection rules span common OWASP Top 10 categories, weighted scoring and differential detection keep false positives low, and safe defaults (circuit breakers and per-host rate limiting) are on out of the box.
Key Features
- Broad vulnerability coverage: SQL injection, XSS, SSRF, LFI, command injection, XXE, SSTI, open redirects, CORS and CSRF issues, insecure headers and cookies, cache poisoning, request smuggling, GraphQL flaws, and more.
- AI-assisted verification: an LLM reviews the evidence behind each finding to cut false positives, and can optionally suggest additional HTTP probes to confirm a vulnerability. Anthropic and OpenAI are supported from the Web UI.
- Intelligent crawler: scope-aware crawling with
robots.txtand sitemap support; optional headless Chromium crawl for JavaScript-rendered applications. - Reports: downloadable HTML and JSON reports for every scan.
- Web UI: run and monitor scans, configure AI verification, inspect raw HTTP traffic, and browse findings from a browser.
Warning
Taka serves plain HTTP and has no built-in authentication. Do not expose it to the public internet. Bind it to a private network. For remote access, place it behind a proxy that provides TLS and authentication.
Getting Started
- Quick Start: install and run your first scan in under five minutes
- Running a Scan: walk through the Web UI
- AI Verification: connect an LLM to validate findings
- Configuration: environment variables and Compose overrides (for later, if you need to tweak ports, timezone, etc.)
Quick Start
Run DARWIS Taka on your own host using Docker Compose.
Prerequisites
- Docker Engine 20.10+
- Docker Compose v2
- 2 GB RAM minimum (4 GB recommended when using the browser-based crawler)
- 2 GB disk space for the image and scan data
1. Clone the repository
git clone https://github.com/CSPF-Founder/taka-docker.git
cd taka-docker
2. Start Taka
docker compose up -d
Docker pulls the cysecurity/darwis-taka:latest image and starts the container. The first run also creates the taka_data named volume that holds the SQLite database (all scans, findings, and saved API keys live inside it).
3. Open the Web UI
Visit http://localhost:7331 in your browser.
Defaults work out of the box. The left navigation has four sections: Dashboard, Scans, Rules, and Settings.
4. Run your first scan
- Click Scans → New Scan.
- Enter a target URL in Target URL (for example, a local test application).
- Leave AI Verification off for now. You can enable it later from Settings.
- Click Start Scan at the bottom of the form.
Taka crawls the target, runs each rule against discovered URLs, and streams live results to the scan detail page.
5. Review results
Once the scan completes, open it to see the findings table, keyed by rule and colour-coded by severity.
Clicking a rule with a single match opens its Finding Detail page, which shows endpoint, parameter, evidence, CWE/CVSS/OWASP classification, remediation, and a reproducing curl command. The scan detail page has JSON and HTML buttons to export the whole scan.
Common Next Steps
| Task | Where to go |
|---|---|
| Change the exposed port, timezone, etc. | Configuration |
| Enable AI-powered verification | AI Verification |
| Keep scan data when recreating the container | Data Persistence |
| Update to a new release | Updating & Lifecycle |
Verify the service
Check container status and logs:
docker compose ps
docker compose logs -f taka
A healthy start-up log ends with a line indicating the Web UI is listening on 0.0.0.0:7331.
Web Interface Overview
The Taka Web UI is how you drive scans in a Docker deployment. It runs on port 7331 inside the container and is published on the host port set by TAKA_PORT (default 7331).
Layout
A persistent sidebar on the left carries four sections:
| Section | Purpose |
|---|---|
| Dashboard | Recent activity and finding counts. |
| Scans | Browse past scans and launch a new one. |
| Rules | Inspect the loaded detection rules. |
| Settings | Global API keys, scan defaults, and AI verification prompts. |
The header shows:
- a Search box that opens a command palette (keyboard shortcut
⌘K/Ctrl+K), searchable over scans, rules, and navigation targets; - a Live indicator driven by the WebSocket connection to the server (green “Live” when connected); and
- a light/dark theme toggle.
Typical flow
- Open Settings once and save an API key for your AI provider if you plan to use AI verification.
- Open Scans → New Scan and fill in a target URL.
- Submit. The scan detail page opens and streams live findings as the engine runs.
- Click any finding to open Finding Details and optionally run AI verification on it.
What’s next
- Settings: save AI provider keys and scan defaults before your first run
- Running a Scan
- Scan Results
- Finding Details
Settings
The Settings page has three cards: AI Provider API Keys, Scan Defaults, and AI Verification Prompts.
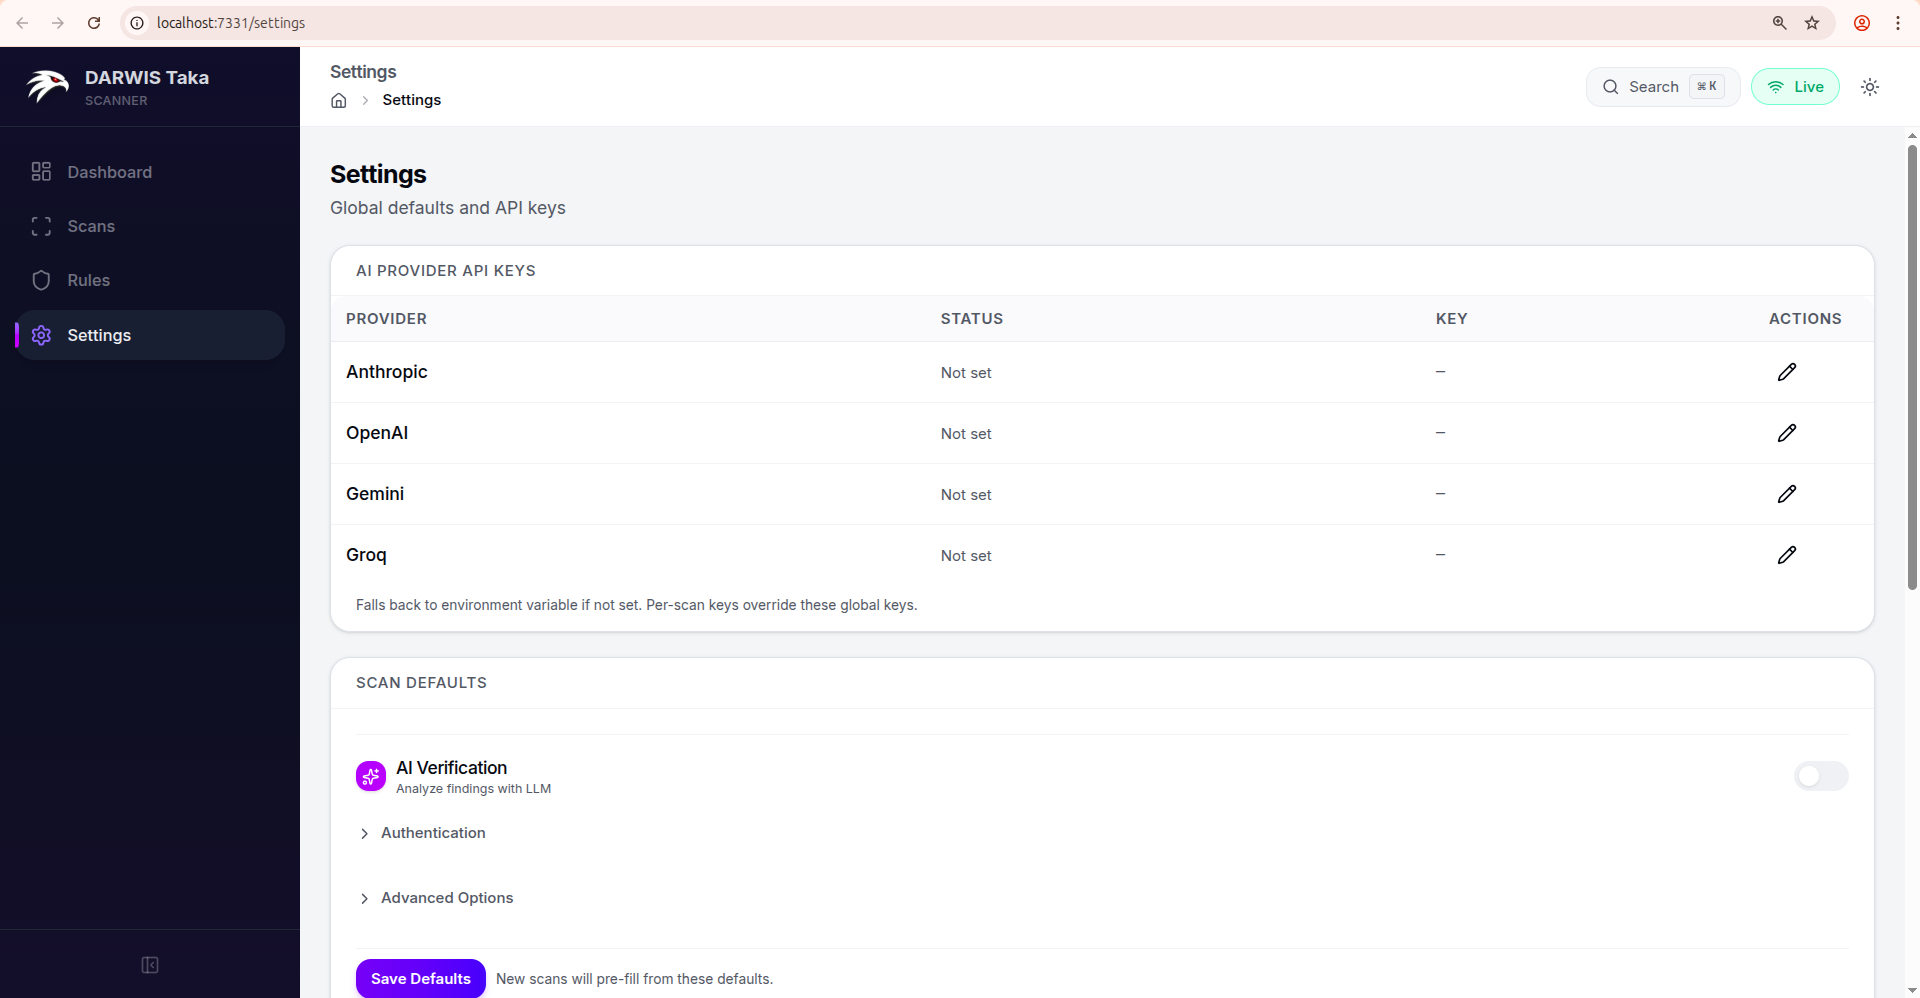
AI Provider API Keys
One row per supported provider:
| Column | Meaning |
|---|---|
| Provider | Anthropic, OpenAI, Gemini, Groq. |
| Status | Configured (green check) or Not set. |
| Key | A masked preview of the saved key, or a dash. |
| Actions | Pencil (edit) and, if a key is saved, a trash icon to remove it. |
Keys are written to taka.db on the /data volume. Rotate a key by editing the row and pasting a new value; no container restart is needed.
Note
The Web UI’s scan form and AI verification drawer currently let you pick between Anthropic and OpenAI when starting a scan. Keys for Gemini and Groq can be saved here for when they’re selectable in future releases.
Important
Key precedence at scan time:
- Per-scan key entered on the New Scan form.
- Global key configured here.
- Environment variable (
ANTHROPIC_API_KEY,OPENAI_API_KEY, …).The first non-empty value wins.
Scan Defaults
Scan Defaults pre-fills the New Scan form on every future scan. It uses the same form as Running a Scan; any field you can set per-scan can be pinned as a default here. The per-scan API Key field is hidden in the defaults form (keys always come from the table above or from the environment).
Click Save Defaults at the bottom to persist. The defaults apply only to new scans; existing scan records are untouched.
Example workflows
Always verify with Anthropic. Toggle AI Verification on, select Anthropic, save defaults. The New Scan form now opens with AI already enabled.
Internal-only scanner. Expand Authentication and add a default header such as X-Internal-Scanner: taka so every scan identifies itself to your WAF.
Ultra-safe scanning. Flip Passive scan only on; new scans start in passive mode and skip rules that send attack payloads.
AI Verification Prompts
The third card lets you override the system and user prompts Taka sends to the LLM during verification. The mode toggle at the top switches between Active Verification and Evidence Analysis; each mode has its own pair of prompts.
| Field | Notes |
|---|---|
| Custom System Prompt | Leave blank to use Taka’s built-in system prompt. |
| Custom User Prompt | Leave blank so finding details are auto-assembled by Taka. |
| Save mode | Persists the override as the new default for that mode. |
| Clear | Removes your saved override (reverts to the built-in prompt). |
When you open the AI Verification drawer on a finding, these saved overrides are pre-filled as the Use custom prompts values. You can still edit them inline per-run.
Resetting defaults
Clear a field and click Save Defaults to remove it from scan defaults. To wipe all defaults, keys, and scan history, recreate the data volume. See Data Persistence.
Running a Scan
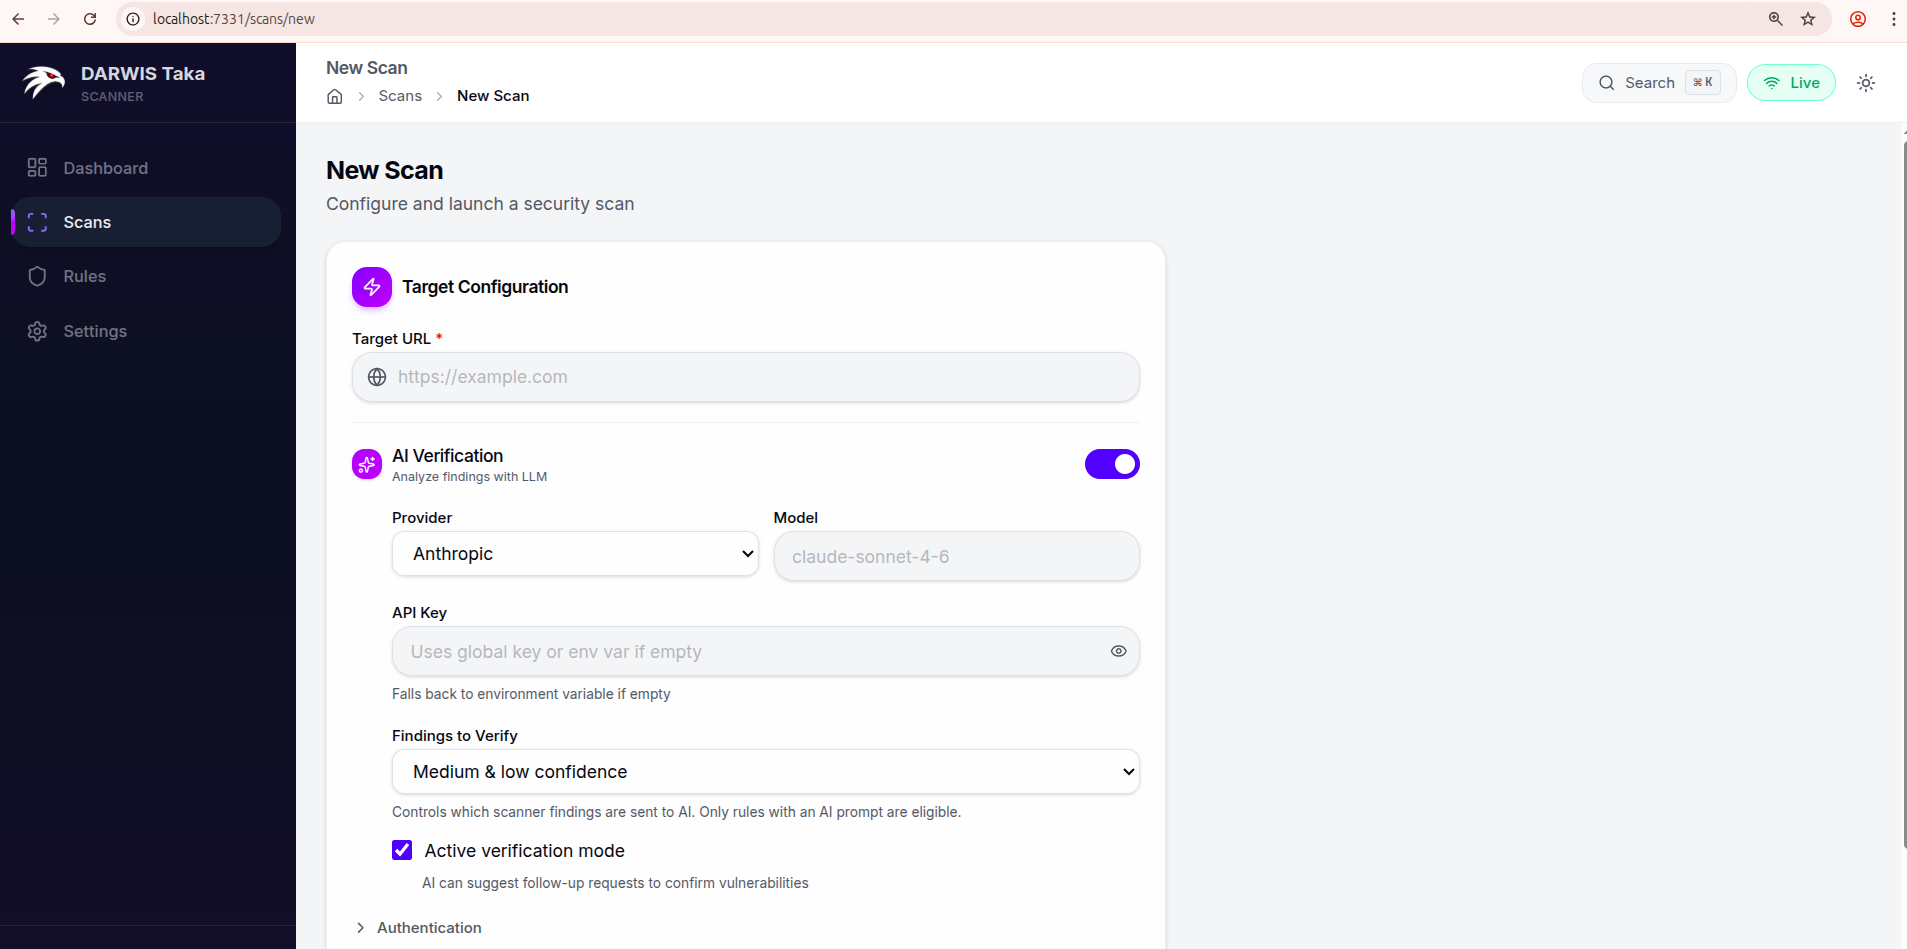
Open Scans → New Scan from the sidebar.
Target Configuration
Target URL
The only required field. Enter the full URL to scan, including the scheme:
https://example.com
https://staging.internal.lan:8443/app
The crawler starts from this URL. If the target needs authentication, expand the Authentication section before submitting.
AI Verification
Toggle AI Verification on to have the scanner send findings to an LLM after the scan runs. The expanded section exposes:
| Field | Description |
|---|---|
| Provider | Anthropic or OpenAI. |
| Model | Optional. Leave blank to use the provider’s default (claude-sonnet-4-6 for Anthropic, gpt-4o for OpenAI). |
| API Key | Per-scan key. Leave blank to fall back to the global key saved in Settings, then to the corresponding environment variable. |
| Findings to Verify | Any confidence, Medium & low confidence, or Low confidence only. Controls which findings are sent to the AI. Rules without an AI prompt are skipped. |
| Active verification mode | Checkbox, on by default. When on, the AI may request follow-up HTTP requests to confirm a vulnerability. When off, the AI only reviews the evidence the scanner already collected. |
See AI Verification for a deeper explanation of the two modes.
Authentication
Click Authentication to expand. Two inputs:
- Custom Headers: textarea, one header per line, format
Name: Value. - Cookies: single line, standard cookie header format (
session=abc123; token=xyz).
Both are sent with every request the scanner and crawler make to the target.
Advanced Options
Click Advanced Options to expand. Available knobs:
| Field | Default | Notes |
|---|---|---|
| Scan Name | (none) | Optional label shown on the scan list. |
| Rule Tags | (none) | Comma-separated tag filter, e.g. xss, sqli, lfi. The authoritative tag list for your installation is under Rules in the sidebar. |
| Concurrency | 10 | Number of concurrent scan tasks. |
| Scan Depth | 2 | Payload depth level. |
| Timeout (seconds) | 30 | Per-request HTTP timeout. |
| Request Delay (ms) | 0 | Delay between scan requests; raise this to rate-limit a fragile target. |
| Passive scan only | off | When on, Taka skips rules that send attack payloads. |
| Spider (sub-toggle) | on | Expands to expose Max Depth (default 4), Max URLs (default 1500), and Exclude URL Patterns (one regex per line). |
| Browser Crawl | Auto-detect | Headless Chromium for JavaScript-rendered pages. Choices: Off, Auto-detect, Always On. |
Submitting
Click Start Scan at the bottom of the form. Taka redirects to the scan detail page, which streams status and findings live as the scan progresses. See Scan Results.
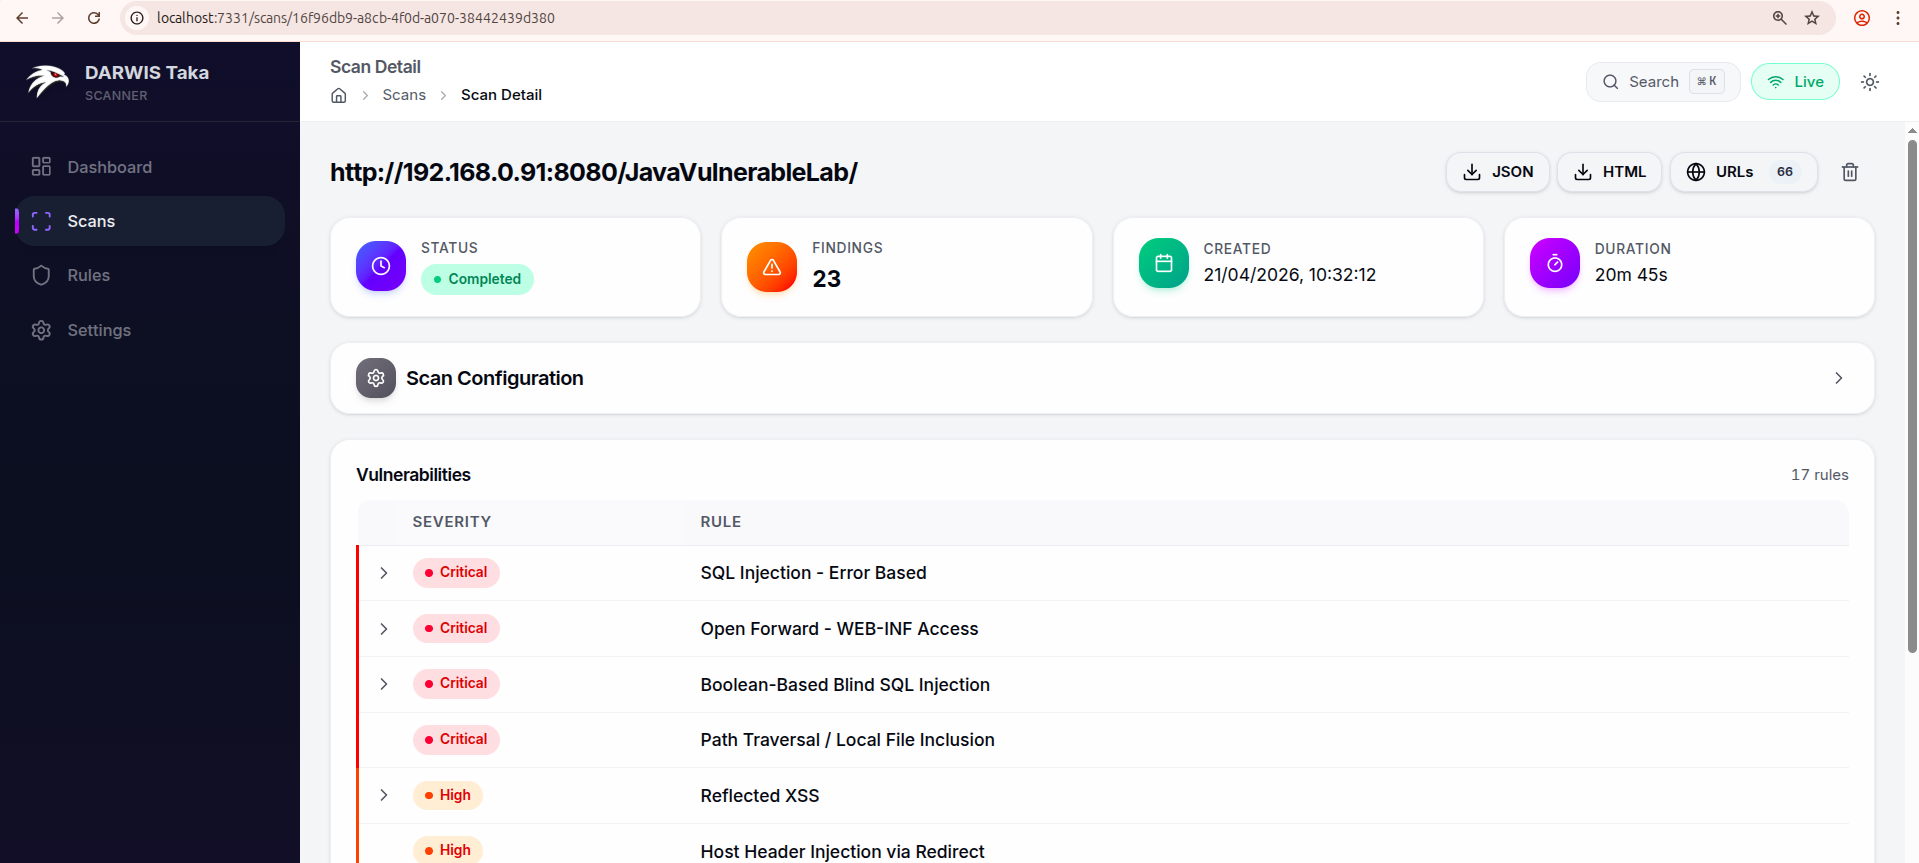
Scan Results
After a scan starts, Taka opens the Scan Detail page and streams updates over a WebSocket as the engine works through the target.
Header summary
The four tiles across the top show the scan’s high-level state:
| Tile | Meaning |
|---|---|
| Status | pending, running, completed, cancelled, or failed. |
| Findings | Number of unique findings so far. |
| Created | Wall-clock time the scan was started. Uses the container’s TZ. See Configuration. |
| Duration | Elapsed time (live while running, final once completed). |
Action buttons
On the right side of the scan title row:
- Cancel (red): visible only while the scan is
running. Stops the scan. - JSON: downloads the full scan result as JSON.
- HTML: downloads a self-contained HTML report.
- URLs (n): visible when the crawler discovered at least one URL. Opens the Crawled URLs page for this scan.
- Delete (trash icon): visible only when the scan is not running. Prompts for confirmation, then removes the scan and all its findings from the database.
Scan Configuration
The collapsible Scan Configuration card replays the options that were set when the scan was created: AI settings (provider, model, mode), rule tags, spider depth and max URLs, and concurrency. If AI verification was enabled, a small “AI Enabled” badge appears in the card header.
Progress (while running)
While the scan is running or pending, a Progress card appears below the configuration. It shows:
- the current phase (Crawling, Scanning, Verifying, etc.) with a stepper;
- a percentage bar; and
- live counters for Tasks, Errors, and Skipped.
The card disappears once the scan reaches completed, cancelled, or failed.
Vulnerabilities list
Findings are presented as a table with one row per rule that matched. Each row shows:
- the severity badge (Critical / High / Medium / Low / Info), with a coloured left border;
- a severity breakdown chip if the rule matched at multiple severities;
- the rule title; and
- either a Deterministic chip (for rules that don’t need AI, where the result is always definitive) or an AI summary indicator showing how many findings for this rule are confirmed, flagged as likely false positive, pending, or inconclusive.
If a rule matched on exactly one endpoint, clicking the row opens Finding Details directly. If it matched on multiple endpoints, clicking expands the row in place and shows a list of matching URLs (with parameter names); clicking any URL opens its Finding Detail page.
A counter in the top-right of the card (17 rules in the screenshot) shows how many distinct rules produced findings, not the total count. One rule can match many URL/parameter combinations.
Live updates
Live updates are driven by a WebSocket subscription to the scan. The scan metadata also refetches every three seconds while running or pending, so transient WebSocket drops don’t stall the UI. When the scan transitions to a terminal state, the vulnerability summary is re-fetched once to pick up any final counts.
If you put Taka behind a reverse proxy, make sure WebSocket upgrades are forwarded; otherwise live findings won’t stream (polling still updates the header tiles and summary).
Finding Details
Clicking a vulnerability row on the scan detail page opens the Finding Detail view.
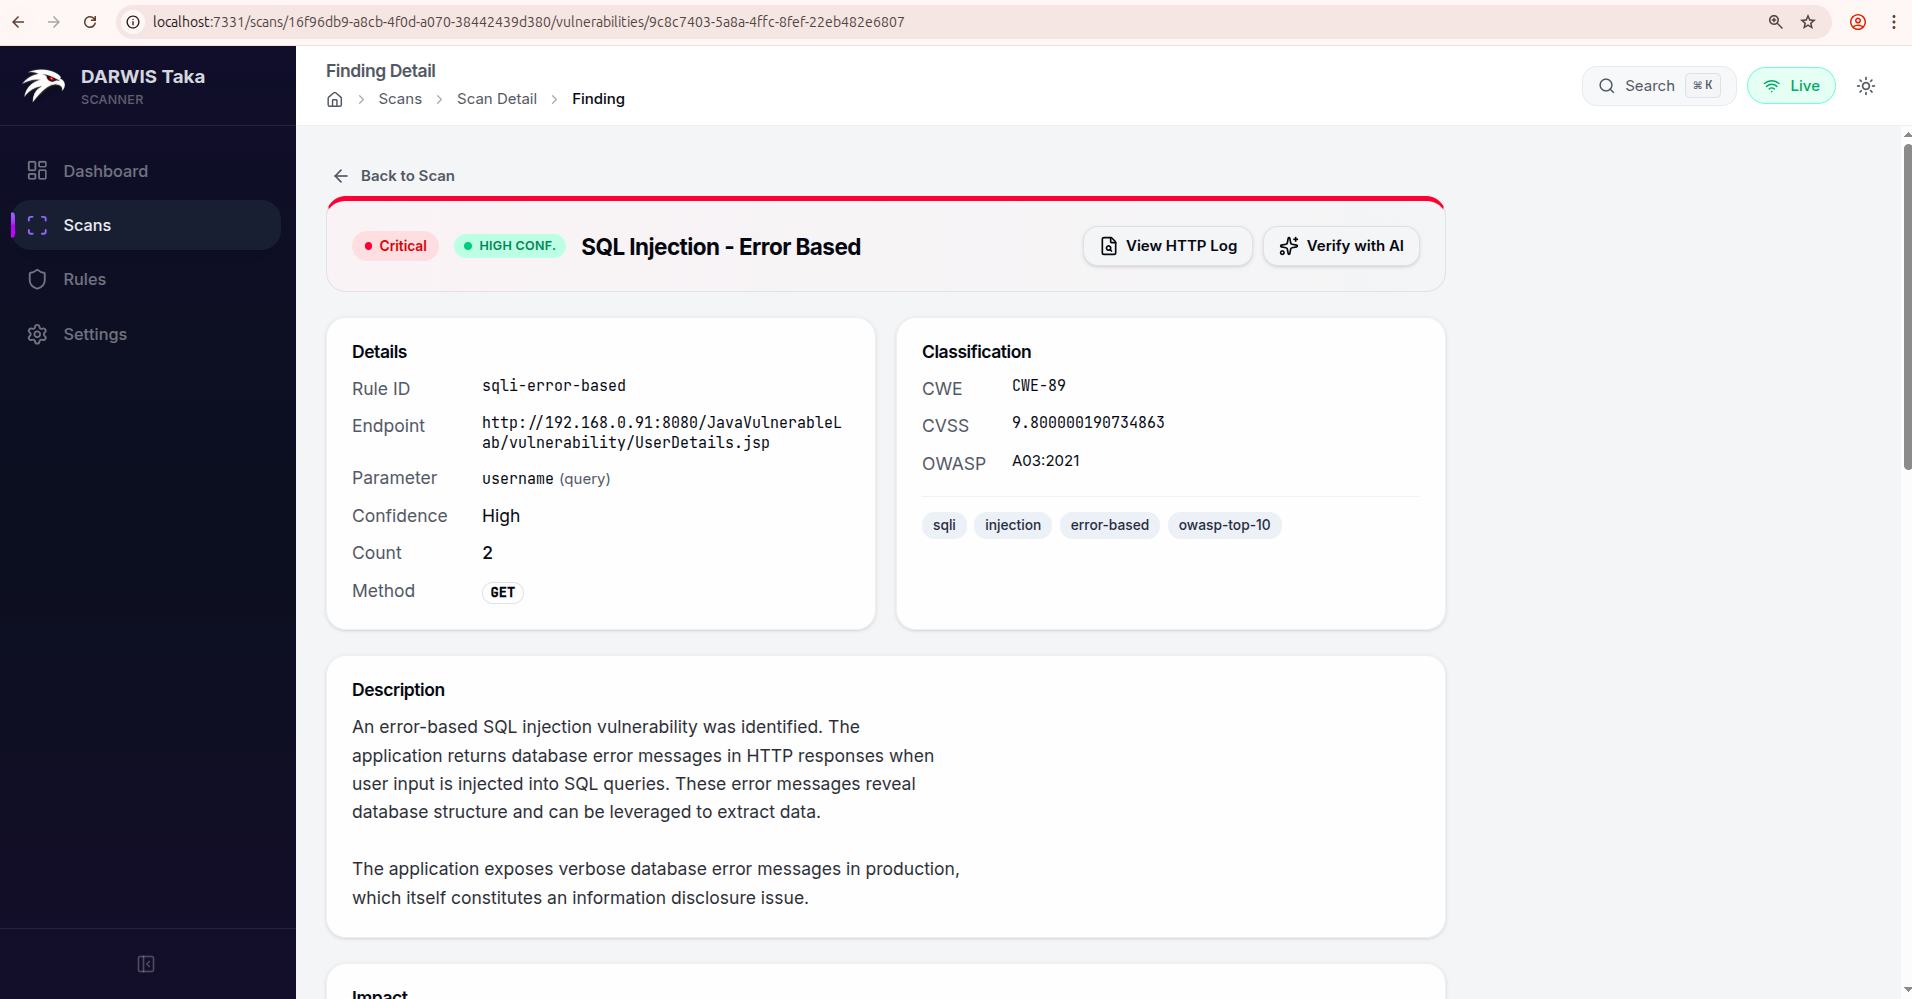
Header
Across the top:
- a Back to Scan link to return to the parent scan;
- the severity badge and (if set) the scanner’s confidence badge;
- the rule name; and
- an AI status badge if AI verification has run on this finding (see Verdict statuses below).
On the right side of the header:
- View HTTP Log: visible when the finding has a captured HTTP method or response status. Opens the raw request/response pair that triggered the match.
- Verify with AI (or Re-verify if a verdict already exists): opens the AI Verification drawer. This button is replaced by a Deterministic check chip for rules that don’t need AI, since those results are pattern-based and always definitive.
Details
Two cards side by side:
Details (left): Rule ID, Endpoint, Parameter (with its location in parentheses, e.g. query, form, header, or cookie), Confidence, Count, and HTTP Method.
Classification (right): CWE, CVSS, OWASP, and a row of Tags at the bottom of the card when present.
Additional sections
Below the two main cards, the following sections are rendered when the rule provides them:
| Section | What it contains |
|---|---|
| Description | Plain-English summary of the vulnerability. |
| Impact | What a successful exploit would let an attacker do. |
| AI Verification | If AI was run: status, confidence meter, reasoning, and any follow-up test results. A Re-verify button is available on this card too. |
| Remediation | Fix guidance from the rule. |
| References | External links (CVE entries, vendor advisories, research blogs). |
| Reproduce | A curl command that reproduces the finding. |
| Payloads | The payload(s) the scanner sent. |
| Evidence | Snippets of the target’s response that matched. |
Only sections whose underlying data exists are shown; a rule that doesn’t ship a remediation string won’t render a Remediation card.
AI Verification drawer
Clicking Verify with AI slides a drawer in from the right.
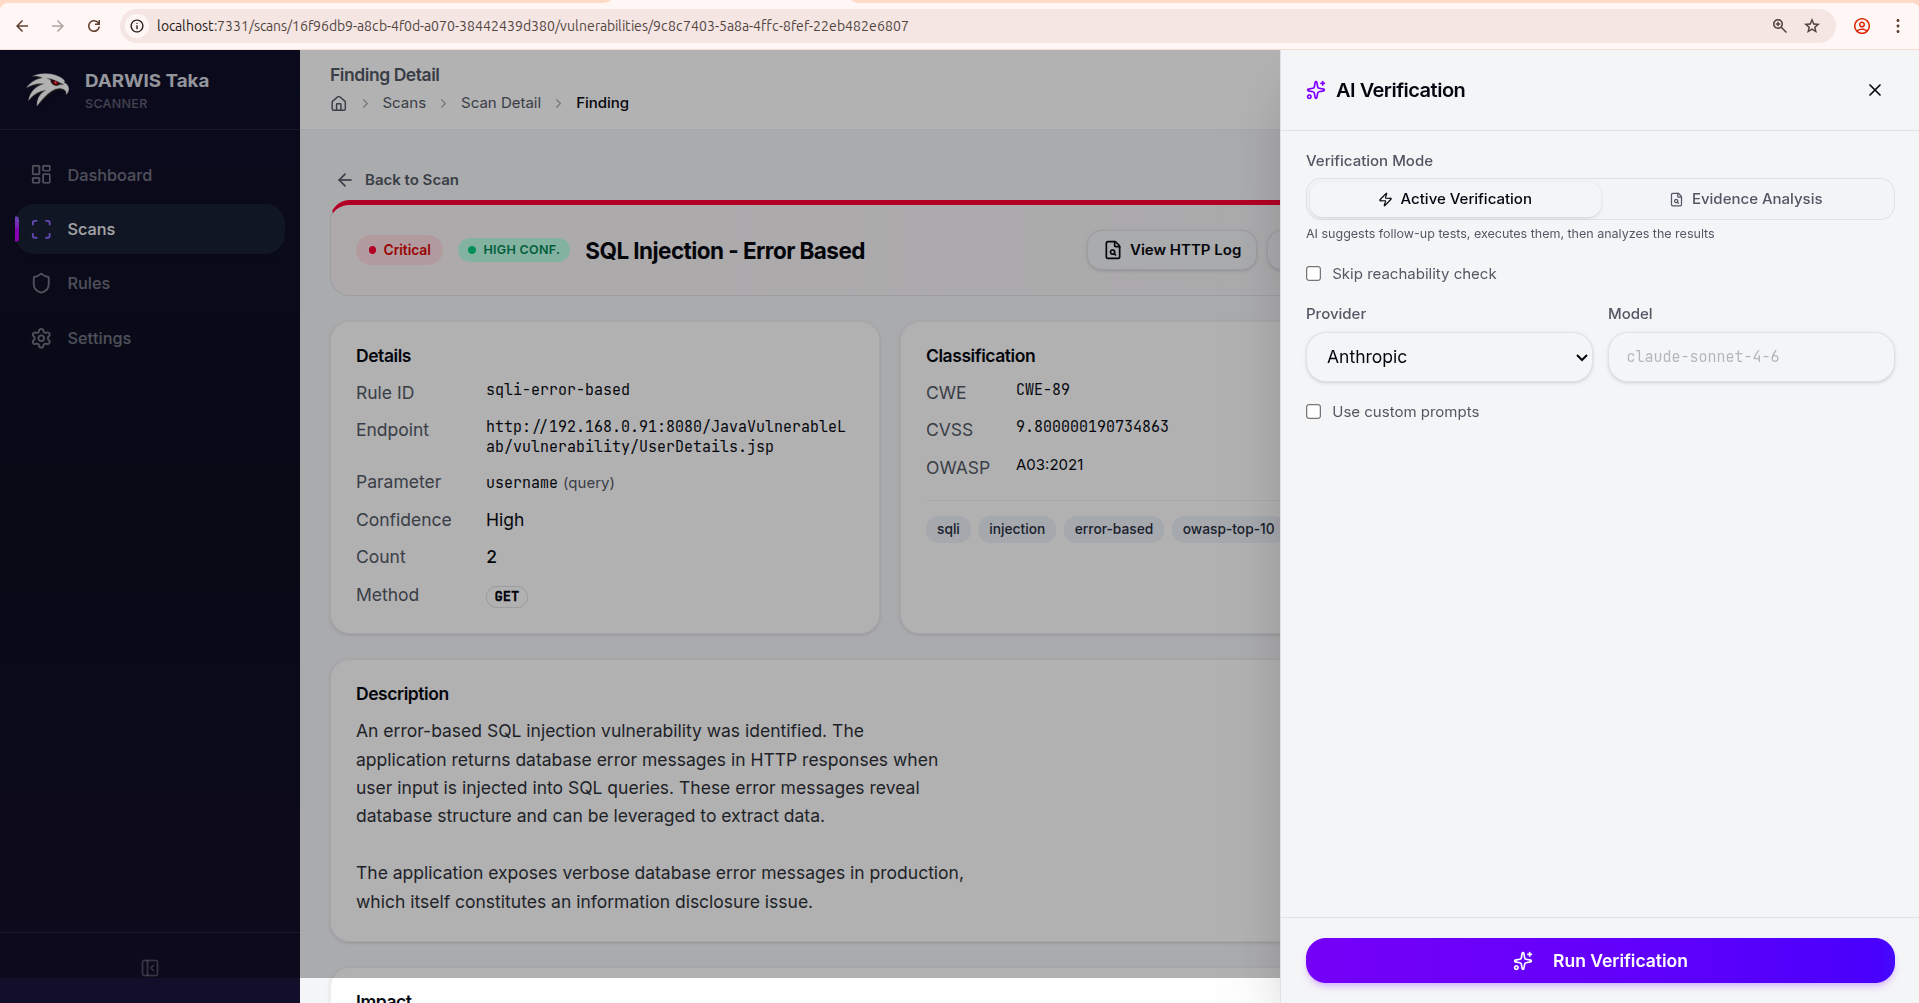
Verification Mode
- Active Verification: the LLM is allowed to suggest follow-up HTTP requests, which Taka sends through the scanner’s HTTP client. The results are fed back to the LLM for a final verdict. Best for findings where the original scanner evidence is ambiguous.
- Evidence Analysis: the LLM only sees the evidence the scanner already collected. No new requests are sent to the target. Use this for production systems or client-owned targets where additional probes would be unwelcome.
In Active mode only, a Skip reachability check checkbox is available. Tick it if the target is off-network or behind a flaky proxy and you want to proceed without the pre-flight check.
Provider, model, and prompts
- The drawer defaults to the provider and model recorded with the finding (or Anthropic/its default if none). You can override either for a single run.
- Use custom prompts reveals the system and user prompt templates. You can edit them inline; a Save as default button saves your edit as the default for this mode (same storage as the AI Verification Prompts card in Settings).
Verdict
After Run Verification completes, the drawer switches to a result view:
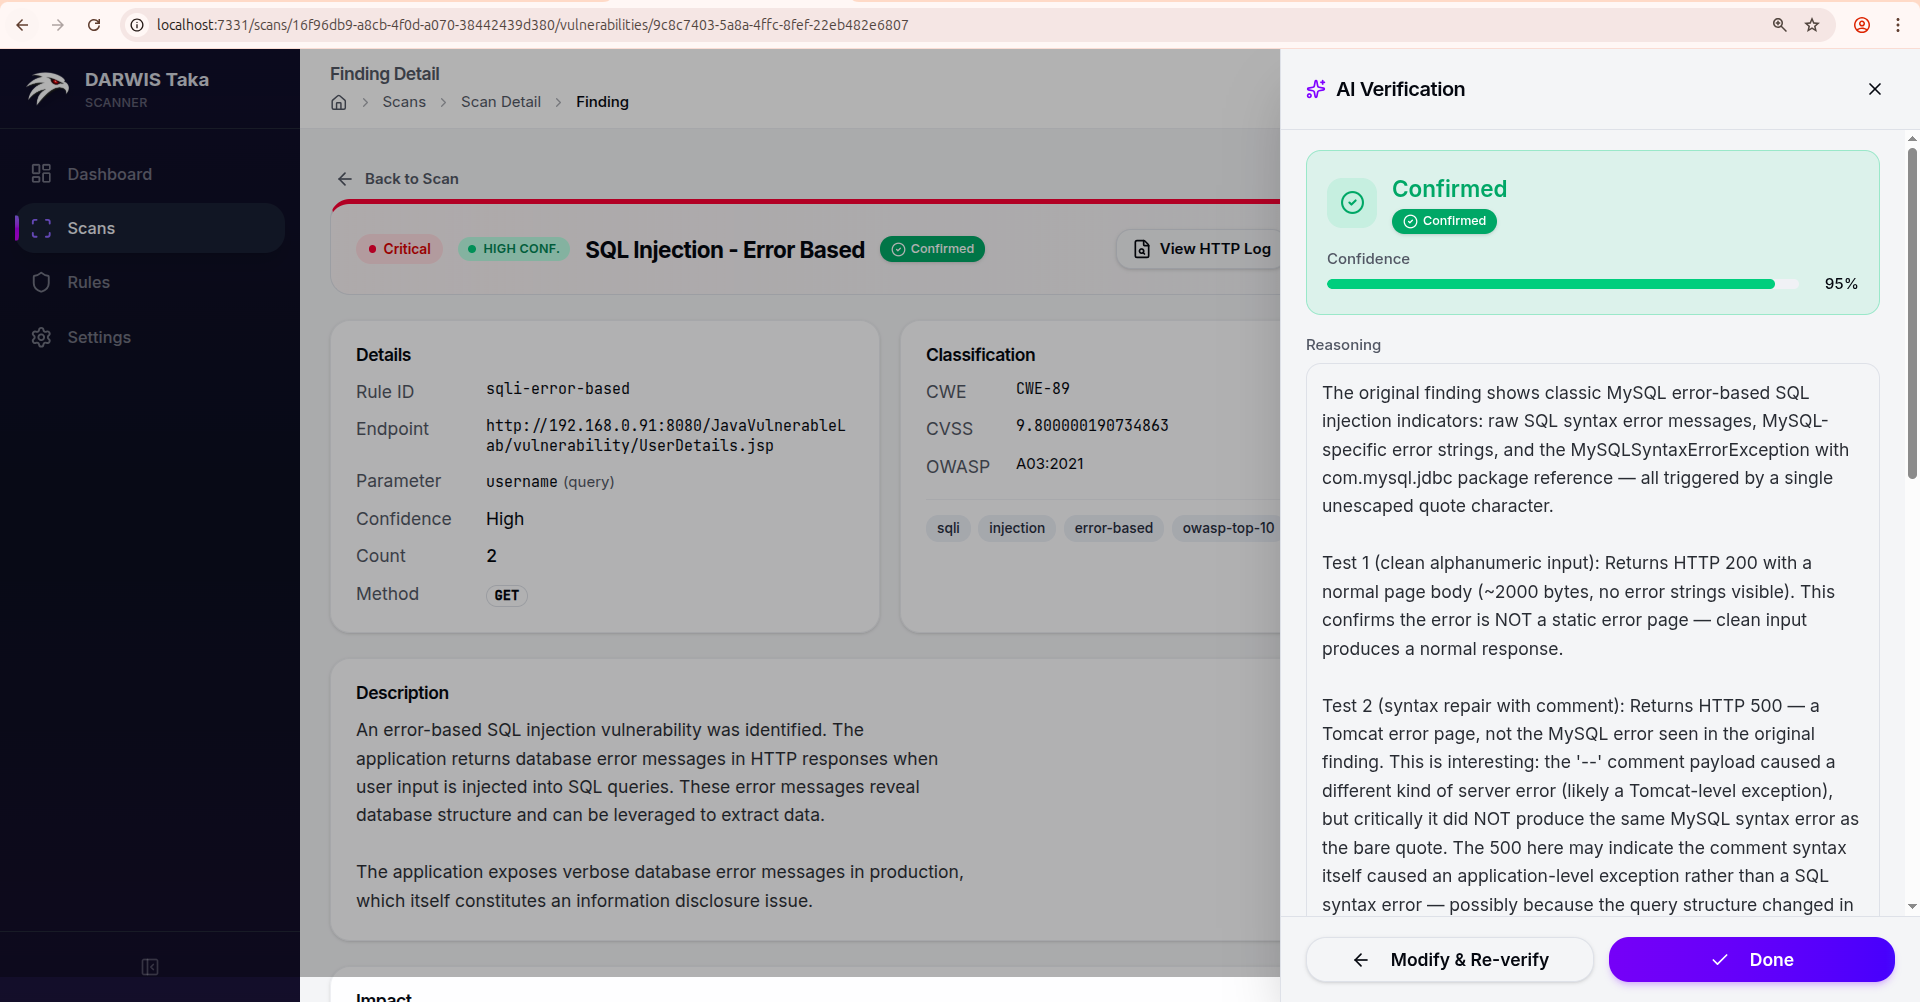
The result card shows the verdict, a Confidence meter (0 to 100%), the Reasoning text, and, in Active mode, the follow-up test results the AI ran. A “Show raw AI response” toggle exposes the unparsed model output.
From here:
- Modify & Re-verify returns to the configure view with your previous settings, so you can tweak the mode, prompts, or model and run again.
- Done closes the drawer. The verdict is saved with the finding and also appears in the AI Verification card on the Finding Detail page.
Verdict statuses
| Status | Meaning |
|---|---|
| Confirmed | The AI believes the finding is a true positive. |
| Likely False Positive | The AI believes the finding is a false positive. Consider excluding the rule for this target. |
| Verification Failed | The verification run failed before producing a verdict (LLM error, bad response, etc.). |
| Partial Result | The LLM produced output that Taka could only partially parse. Reasoning may be available but the verdict isn’t fully trustworthy. |
| AI Verifying… | The run is still in progress. |
| AI Unverified | AI verification was enabled for the scan but hasn’t run on this finding yet. |
Findings marked Likely False Positive are not deleted; Taka always keeps the original rule match. Use the verdict as a triage signal, not a silencing mechanism.
Export
Findings are included in both the JSON and HTML exports available from the scan detail page. The AI verdict, if any, is included alongside each finding.
AI Verification
AI verification is an optional post-processing step that asks a large language model to review Taka’s findings and either confirm them or flag them as false positives. The scanner itself is complete without it; AI verification trades LLM cost and latency for fewer false positives and richer reasoning in reports.
How it works
- During a scan, Taka’s rule engine produces findings with evidence (HTTP request, response, match context, timing).
- When AI verification is enabled for a scan, each finding that matches the Findings to Verify filter is sent to the configured LLM together with:
- a system prompt that tells the model what to do;
- the raw evidence collected by the scanner; and
- a fixed JSON output schema (
status,confidence,reasoning).
- The LLM returns a verdict; Taka stores it alongside the finding.
- If Active Verification is the selected mode, the model may request additional HTTP probes; Taka sends them through the scanner’s HTTP client and loops the responses back into the prompt for a final verdict.
Rules that are deterministic (pattern-based) don’t need AI and are skipped; they’re shown with a Deterministic check chip in the UI.
Verification modes
| Mode | Extra traffic to target? | When to use |
|---|---|---|
| Evidence Analysis | No. Only the evidence the scanner captured is sent to the LLM. | Production systems, client-owned targets, or scans where additional requests would be unwelcome. |
| Active Verification | Yes. The model can request follow-up probes. | Dev, staging, or CTF targets where ambiguous findings are common. |
Both modes return the same verdict shape; they differ only in whether the model is allowed to initiate new requests.
Providers
The Web UI lets you pick from two providers when starting a scan or verifying a single finding:
| Provider | Environment variable (fallback) | Default model |
|---|---|---|
| Anthropic | ANTHROPIC_API_KEY | claude-sonnet-4-6 |
| OpenAI | OPENAI_API_KEY | gpt-4o |
Additional provider keys (Gemini, Groq) can be saved in Settings but are not currently selectable from the Web UI. Anthropic is the primary provider Taka is tested against.
Configuring keys
Three places can provide a key, with this precedence:
- Per-scan: entered on the New Scan form. Overrides everything else. Not reused on other scans.
- Global: saved in Settings. Used for every scan where the per-scan field is blank.
- Environment variable: read from the container’s environment at scan time. Used when neither per-scan nor global is set.
Setting a key via environment variable
Add it to docker-compose.yml:
services:
  taka:
    # ...
    environment:
      TZ: ${TZ:-UTC}
      ANTHROPIC_API_KEY: ${ANTHROPIC_API_KEY}
And put the secret in your .env:
ANTHROPIC_API_KEY=sk-ant-...
For most deployments the Settings UI is simpler; it lets you rotate keys without restarting the container.
Cost control
AI verification can call the LLM many times per scan. To keep costs bounded:
- Set Findings to Verify on the New Scan form to a narrower scope (for example
Low confidence only). - Prefer Evidence Analysis over Active Verification when you don’t need probing.
- Pick a cheaper model (e.g. Claude Haiku, GPT-4o-mini) via the Model field for bulk scanning; use a larger model only for manual re-verification of disputed findings.
- Filter the scan’s rule set with Tags so fewer findings are produced in the first place.
Verdicts
Each verified finding carries a status, a self-reported confidence (0–100%), and a reasoning block. In Active mode, the follow-up test results the AI issued are stored as well.
| Status | Meaning |
|---|---|
| Confirmed | The AI believes the finding is a true positive. |
| Likely False Positive | The AI believes the finding is a false positive. |
| Verification Failed | The verification run failed before producing a verdict. |
| Partial Result | The LLM produced output that Taka could only partially parse. |
| AI Verifying… | The run is still in progress. |
| AI Unverified | AI verification was enabled for the scan but hasn’t run on this finding. |
Verdicts surface on the Finding Detail page (see Finding Details) and in both the JSON and HTML exports.
Note
A Likely False Positive verdict does not automatically delete the finding; Taka always keeps the original rule match. Treat the verdict as a triage signal, not a silencing mechanism.
Custom prompts
If the built-in prompts don’t fit your workflow, you can override them in two places:
- Per run: tick Use custom prompts in the AI Verification drawer on a finding. Edit the system and/or user prompt inline.
- Globally: use the AI Verification Prompts card in Settings to save overrides per mode. New drawer sessions pre-fill from these.
Leaving a custom field blank means Taka falls back to its built-in prompt for that slot.
Configuration
DARWIS Taka’s Docker deployment is configured entirely through environment variables passed to the container. The shipped docker-compose.yml reads from a .env file alongside it, so the recommended workflow is:
- Create a
.envfile next todocker-compose.yml. - Set the variables you want to override (see table below).
- Run
docker compose up -d.
Docker Compose automatically picks up .env.
Default docker-compose.yml
services:
  taka:
    image: cysecurity/darwis-taka:latest
    container_name: taka
    restart: unless-stopped
    ports:
      - "${TAKA_PORT:-7331}:7331"
    environment:
      TZ: ${TZ:-UTC}
    volumes:
      - taka_data:/data

volumes:
  taka_data:
Environment Variables
| Variable | Default | Description |
|---|---|---|
TAKA_PORT | 7331 | Host port to bind the Web UI on. The container always listens on 7331 internally. |
TZ | UTC | Container timezone. Affects timestamps in logs and the Web UI. Use an IANA name such as Europe/London or Asia/Kolkata. |
Note
AI provider API keys are not configured via environment variables. They are saved in the database through the Settings page so they can be rotated without restarting the container. They can also be overridden per scan.
Example .env
# Expose the Web UI on host port 8080 instead of 7331
TAKA_PORT=8080

# Use a local timezone so scan timestamps match your clock
TZ=Europe/Berlin
After editing .env, apply the changes:
docker compose up -d
Compose recreates the container with the new settings; the taka_data volume is preserved, so scans, rules, and API keys remain intact.
Binding to a private interface
By default, the port mapping "${TAKA_PORT:-7331}:7331" listens on all host interfaces. To restrict Taka to the loopback interface (so only processes on the host, or an SSH tunnel, can reach it), edit docker-compose.yml:
    ports:
      - "127.0.0.1:${TAKA_PORT:-7331}:7331"
This is the recommended setup when you front Taka with a reverse proxy on the same host.
Resource limits
For larger workloads you can add resource limits under the service:
services:
  taka:
    # ...
    deploy:
      resources:
        limits:
          cpus: "4.0"
          memory: 4G
The headless Chromium crawler is the most memory-hungry component. If you run many concurrent deep scans, give the container at least 4 GB of memory.
Data Persistence
All mutable state lives under /data inside the container. The shipped docker-compose.yml mounts a Docker named volume there:
volumes:
  - taka_data:/data
What is stored
| Path inside container | Contents |
|---|---|
/data/taka.db | SQLite database: scans, findings, API keys, scan defaults, custom AI prompts |
/data/taka.db-shm, /data/taka.db-wal | SQLite write-ahead log and shared memory |
Losing /data means losing your scan history and saved API keys. JSON and HTML reports are generated on demand from the database; they live inside taka.db, not as separate files on disk. The rule set itself is baked into the image.
Named volume (default)
With the default configuration, Docker manages the volume:
# Inspect the volume
docker volume inspect taka-docker_taka_data

# Find its location on disk (Linux)
docker volume inspect taka-docker_taka_data \
  --format '{{ .Mountpoint }}'
The volume survives docker compose down but is destroyed by docker compose down -v.
Bind mount (host directory)
If you prefer the data to live in a directory you can browse directly (for example to back it up with existing host tooling), replace the volumes: section in docker-compose.yml:
services:
  taka:
    # ...
    volumes:
      - ./data:/data

# Remove the top-level `volumes:` block when using a bind mount.
Create the directory before starting the container:
mkdir -p data
docker compose up -d
Important
The container process writes as its internal user. On some hosts you may need to
chownthe./datadirectory so the container can write to it. If Taka fails to start with apermission deniedontaka.db, check the ownership and mode of the host directory.
Backing up
Because the database is SQLite, the safest way to back up is to stop the container first:
docker compose stop
cp -r data data-backup-$(date +%F)
docker compose start
For hot backups (container running), use the SQLite .backup command inside the container:
docker compose exec taka sh -c \
  "sqlite3 /data/taka.db '.backup /data/taka.backup'"
Then copy /data/taka.backup out of the volume.
Migrating to a new host
docker compose downon the old host.- Copy the volume contents (either the bind-mount directory or the named volume’s
Mountpoint) to the new host. - Place the data under the same path (or reconfigure
docker-compose.yml). docker compose up -don the new host.
The database format is stable across patch releases. For major upgrades, review the release notes first. See Updating & Lifecycle.
Resetting
To wipe all scan history and start fresh:
docker compose down -v   # -v removes the named volume
docker compose up -d
With a bind mount, delete the host directory instead:
docker compose down
rm -rf ./data
docker compose up -d
Updating & Lifecycle
Updating to the latest image
docker compose pull
docker compose up -d
docker compose pull fetches the newer cysecurity/darwis-taka:latest image; up -d recreates the container using it. Your taka_data volume is preserved, so scans, reports, and saved API keys survive the upgrade.
Pinning a specific version
Using :latest in production makes redeploys non-deterministic. Pin to a tagged release instead:
services:
  taka:
    image: cysecurity/darwis-taka:1.0.0   # pin to a specific tag
Check Docker Hub for available tags.
Starting and stopping
docker compose start   # start an existing, stopped container
docker compose stop    # stop the container but keep it
docker compose restart # stop + start
Tearing down
docker compose down         # stop and remove the container, keep data
docker compose down -v      # stop, remove the container, and delete the data volume
Warning
docker compose down -vpermanently deletes scan history, findings, reports, and saved API keys. Make a backup first if any of that matters to you.
Watching logs
docker compose logs -f taka
Logs are written to Docker’s default JSON log driver. On long-running hosts, add log-rotation limits to docker-compose.yml:
services:
  taka:
    # ...
    logging:
      driver: json-file
      options:
        max-size: "10m"
        max-file: "5"
Shell access inside the container
docker compose exec taka sh
From the shell, /data contains the database and reports; the Taka binary is on PATH. This is mostly useful for troubleshooting. Normal operation never requires it.
Rollback
If a new version behaves badly, roll back to a previously known-good tag:
services:
  taka:
    image: cysecurity/darwis-taka:1.0.0   # previous good tag
docker compose up -d
The SQLite schema is backward compatible within a minor series. Between major releases, check the release notes; a rollback may require restoring a backup of /data.
Troubleshooting
Gather context first
Before digging into specific symptoms, collect three things:
docker compose ps                # is the container actually running?
docker compose logs --tail=200 taka   # recent server logs
docker compose exec taka sh -c 'ls -la /data'   # database present?
The logs are almost always where the real error surfaces.
Web UI won’t load
Check: docker compose ps. Is the container Up?
If it’s restarting in a loop, the logs will show why. The most common causes are:
- Port already in use. Change
TAKA_PORTin.envto a free port (see Configuration). - Permission denied on
/data. Happens with bind mounts when the host directory isn’t writable by the container.chownthe host directory or switch to the named volume (see Data Persistence).
If the container is up but the browser can’t reach it:
- Confirm the port mapping:
docker compose port taka 7331. - If you bound to
127.0.0.1, you need a reverse proxy or SSH tunnel to reach it from another host.
Scans never finish / hang mid-way
- Check the target is reachable from inside the container.
docker compose exec taka sh -c 'wget -qO- https://target.example.com'. - Lower concurrency. If the target (or a WAF in front of it) is rate-limiting you, the scanner may slow down or stall. On the New Scan form (Advanced Options), drop Concurrency and raise Request Delay (ms).
- Live updates stopped but the scan is still running. Usually a WebSocket timeout at the reverse proxy. The scan itself is unaffected; refresh the page to pull the latest state. Fix the proxy config to keep WebSockets alive.
Crawler misses JavaScript-rendered pages
The image bundles Chromium for headless crawling. Common reasons it may fail:
- Not enough memory. Chromium needs 1–2 GB free. Give the container at least 4 GB for deep scans (see Configuration).
- Kernel disallows user namespaces. Required by Chromium’s sandbox. Most modern Linux distributions allow them by default; check
sysctl kernel.unprivileged_userns_cloneon Debian/Ubuntu. - Running on Docker Desktop for Mac/Windows with low memory. Raise the VM memory in Docker Desktop settings.
AI Verification errors
“Invalid API key”: the key saved in Settings doesn’t match the selected provider. Paste the key again and confirm it has the right prefix (sk-ant-… for Anthropic, sk-… for OpenAI).
“Rate limit exceeded”: your provider account is throttled. Switch to a cheaper model, narrow the Findings to Verify scope, or wait for the limit to reset.
Verdict status is “Partial Result” or “Verification Failed”. Some smaller or older models produce malformed structured output that Taka can only partially parse. Use the Re-verify button on the Finding Detail page with a stronger model (a flagship Claude Sonnet or a GPT-4-class model).
Target appears unreachable. In Active Verification mode, Taka performs a pre-flight reachability check before calling the LLM. If the target is intentionally off-network (e.g. an asset you captured traffic from but cannot hit directly), tick Skip reachability check in the AI Verification drawer and proceed.
Reports fail to download
Reports are generated on request from the database. Causes:
- Scan still running. Wait for
Completed. - Volume full.
docker system dfon the host. If/datais out of space, exports fail silently; free space, then retry.
Resetting without losing scans
If the UI is broken but you think the database is fine:
docker compose down
docker compose up -d
If that doesn’t help, pull a known-good tag (see Updating & Lifecycle); the database schema is forward-compatible.
Starting completely fresh
docker compose down -v
docker compose up -d
This destroys scan history, findings, and API keys. Back up first if any of that matters to you.
Still stuck?
Open an issue with the output of:
docker compose version
docker compose ps
docker compose logs --tail=500 taka
Redact URLs, tokens, and anything else sensitive before sharing.